Fig. 2.
Download original image
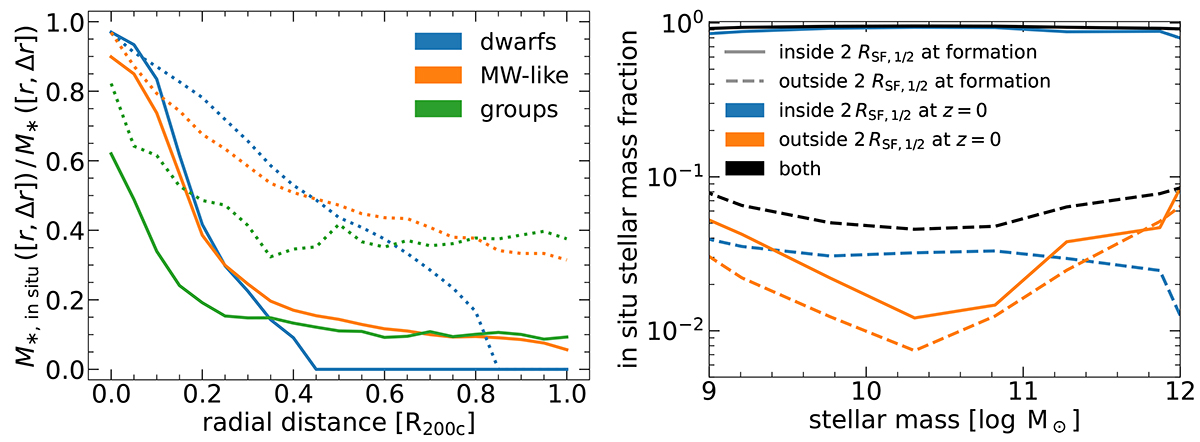
Radial distribution of the in situ stellar mass fraction (left) and distinguishing stellar origins (right). The left panel shows radial profiles of the in situ stellar fraction for dwarfs (blue), Milky Way mass galaxies (orange), and groups (green). Solid curves correspond to z = 0 profiles, and dotted to the progenitors of these galaxies at z = 2. In all three mass bins, in situ stars dominate the central regions of the halo, while ex situ stars dominate in the outskirts. This radial dependence is stronger at z = 0. The right panel shows the in situ stellar mass fractions formed inside (solid) and outside 2 RSF, 1/2 (dashed), relative to the total in situ component as a function of z = 0 galaxy stellar mass. Blue curves correspond to stars located within 2 RSF, 1/2 at z = 0, those outside in orange, and the total in black. Most stars formed inside continue to reside within this region at z = 0 following their formation, while most of the stars forming outside 2 RSF, 1/2 migrate inward, except in the highest mass galaxies.
Current usage metrics show cumulative count of Article Views (full-text article views including HTML views, PDF and ePub downloads, according to the available data) and Abstracts Views on Vision4Press platform.
Data correspond to usage on the plateform after 2015. The current usage metrics is available 48-96 hours after online publication and is updated daily on week days.
Initial download of the metrics may take a while.