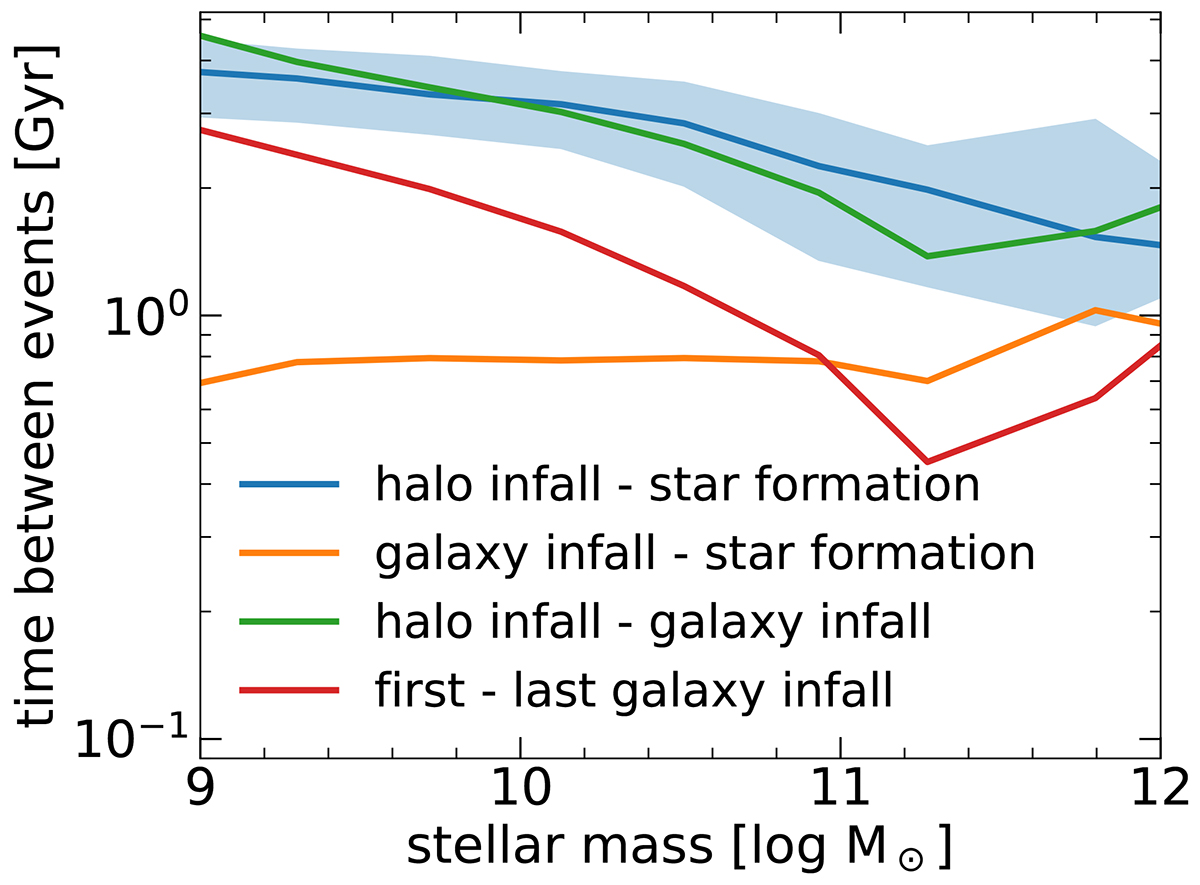
Fig. 11.
Download original image
Temporal lag between various spatial crossing and star formation events. In blue (orange), we show the time difference between the moment that a tracer last crossed R200c (2 RSF, 1/2), i.e., halo infall (galaxy infall) and that when its parent gas cell is converted into a star particle. The time gap between the two infall events (green) is contrasted against the time elapsed between the first and the last crossing of 2 RSF, 1/2 (red). All curves show medians across the galaxy population and the value for each galaxy is also the median of all its tracers that actually undergo the event(s), always taking absolute values (see text). Gas accretion onto galaxies proceeds over several ∼Gyr, while the eventual collapse of ISM gas into stars occurs on shorter time scales (≲Gyr), as long as it is not recycled back into the halo due to feedback.
Current usage metrics show cumulative count of Article Views (full-text article views including HTML views, PDF and ePub downloads, according to the available data) and Abstracts Views on Vision4Press platform.
Data correspond to usage on the plateform after 2015. The current usage metrics is available 48-96 hours after online publication and is updated daily on week days.
Initial download of the metrics may take a while.