Fig. 1.
Download original image
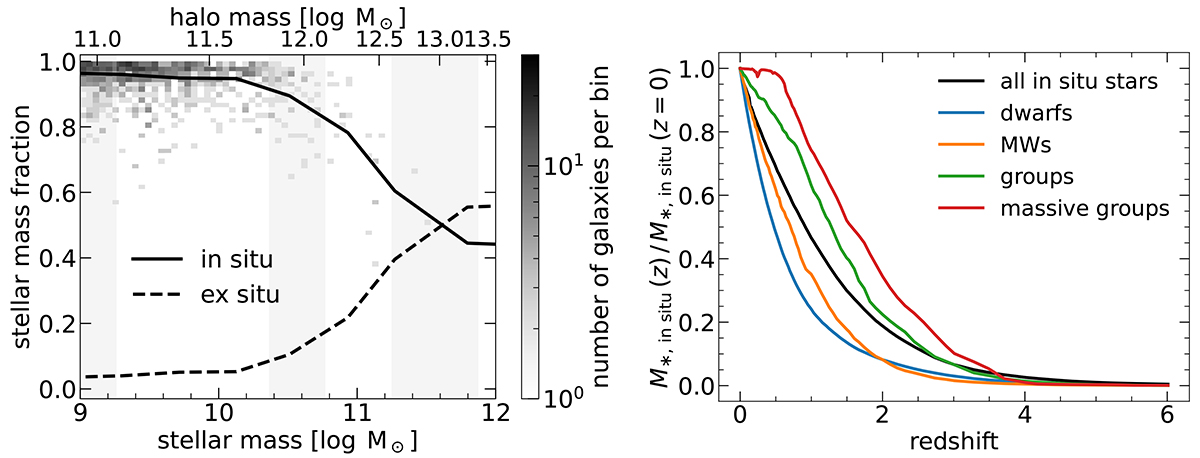
Distribution of in situ stellar mass fraction versus galaxy stellar mass (left) and the time evolution of this fraction (right). In the left panel, we show trends of in situ (solid) and ex situ (dashed) stellar mass fractions as a function of galaxy stellar mass at z = 0. The in situ fraction is ≳90% at the low stellar-mass end (M⋆ ≲ 1010 M⊙), decreasing to ∼40% for massive M⋆ ∼ 1012 M⊙ galaxies. For reference, the top axis shows the corresponding halo masses and the background colored pixels show the halo-to-halo scatter. The three vertical gray bands in the background show the three halo mass bins used in this work (Table 1). In the right panel, we show the in situ mass buildup of galaxies over cosmic time, normalized to their z = 0 mass. The blue, orange, green, and red curves correspond to dwarfs, MWs, groups, and more massive groups, respectively. For comparison, we also include the evolutionary profile of all in situ stars from the simulation domain in black. More massive galaxies form a given fraction of in situ stellar mass at earlier times.
Table 1.
Overview of the halo mass bins commonly used throughout our analysis.
Notes. We focus on three disjoint subsets: low-mass dwarfs, intermediate-mass Milky Way-like halos, and high-mass groups. The second column specifies their range in halo mass, while the number of halos (at z = 0) in the corresponding bin is listed in the third column.
Current usage metrics show cumulative count of Article Views (full-text article views including HTML views, PDF and ePub downloads, according to the available data) and Abstracts Views on Vision4Press platform.
Data correspond to usage on the plateform after 2015. The current usage metrics is available 48-96 hours after online publication and is updated daily on week days.
Initial download of the metrics may take a while.