Open Access
Fig. 9
Download original image
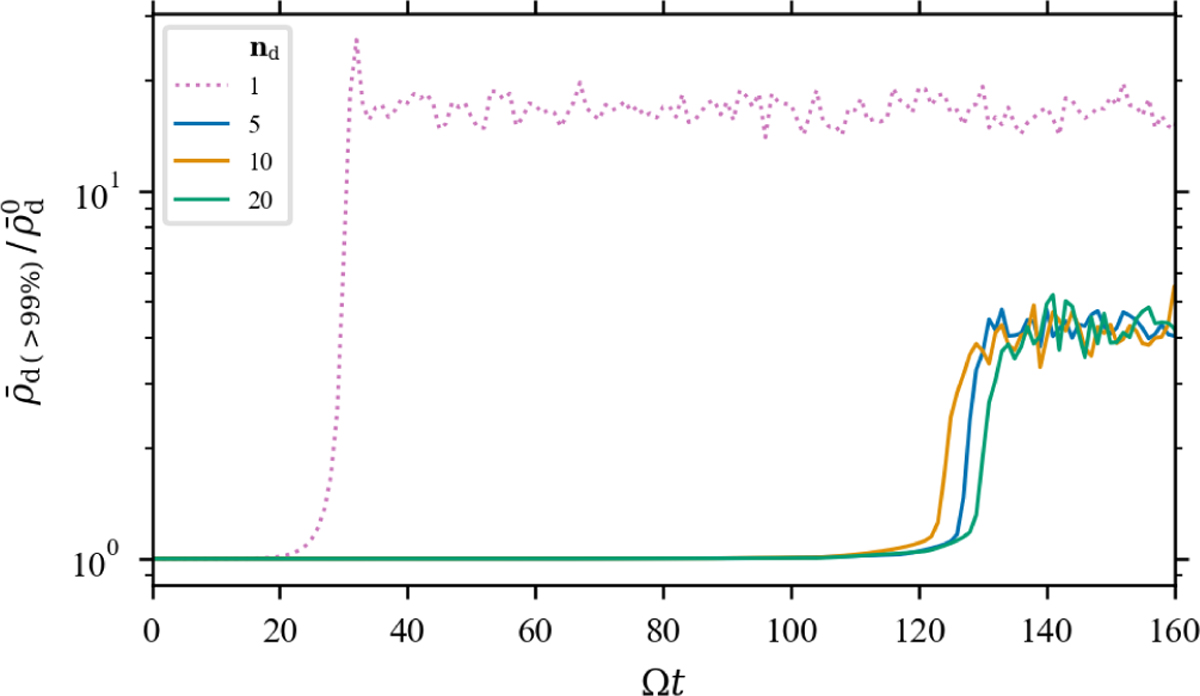
Normalised mean density at the 99th percentile for different numbers of dust species from run mSI1024 (indicated with a dotted pink line), run PSI511024 (in blue), run PSI101024 (in orange), and run PSI201024 (in green).
Current usage metrics show cumulative count of Article Views (full-text article views including HTML views, PDF and ePub downloads, according to the available data) and Abstracts Views on Vision4Press platform.
Data correspond to usage on the plateform after 2015. The current usage metrics is available 48-96 hours after online publication and is updated daily on week days.
Initial download of the metrics may take a while.