Fig. 7
Download original image
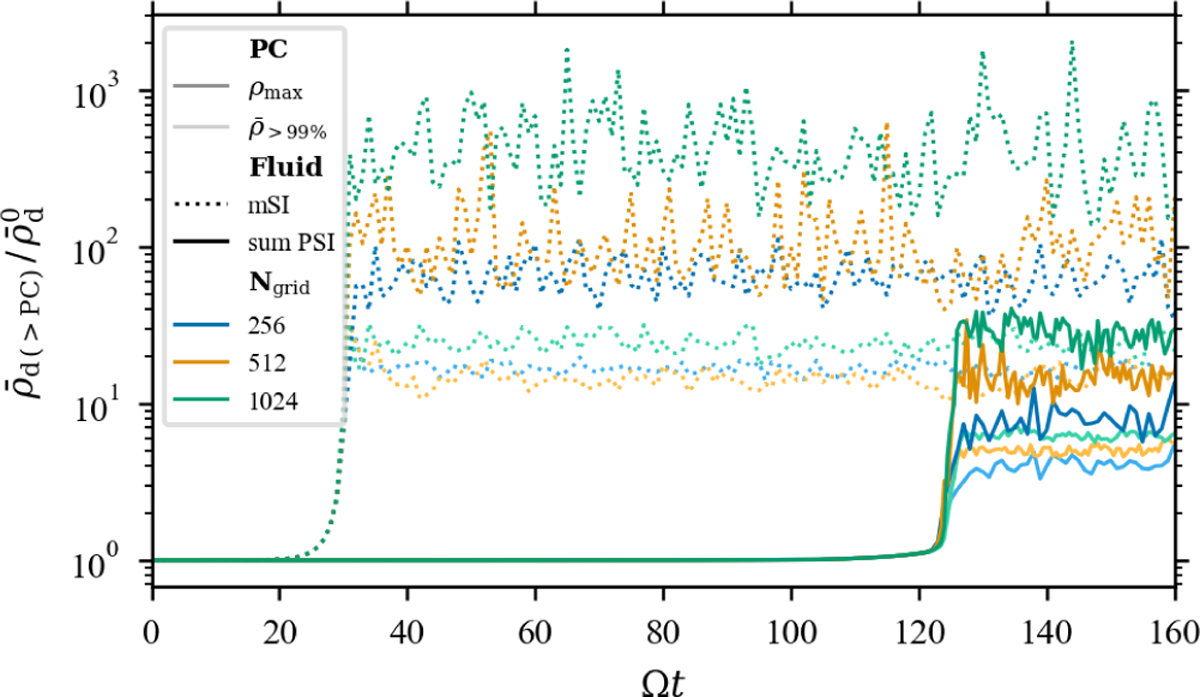
Normalised (mean) density at the densest pixel and at the 99th percentile (indicated by darker and lighter colours; respectively) for different spatial resolutions. The mSI runs at different resolutions are indicated with the dotted line for run mSI1024, mSI512, and mSI using green, orange, and blue, respectively. The PSI runs PSI101024, PSI10512, and PSI10 have the same colour coding as the mSI runs.
Current usage metrics show cumulative count of Article Views (full-text article views including HTML views, PDF and ePub downloads, according to the available data) and Abstracts Views on Vision4Press platform.
Data correspond to usage on the plateform after 2015. The current usage metrics is available 48-96 hours after online publication and is updated daily on week days.
Initial download of the metrics may take a while.