Fig. 4
Download original image
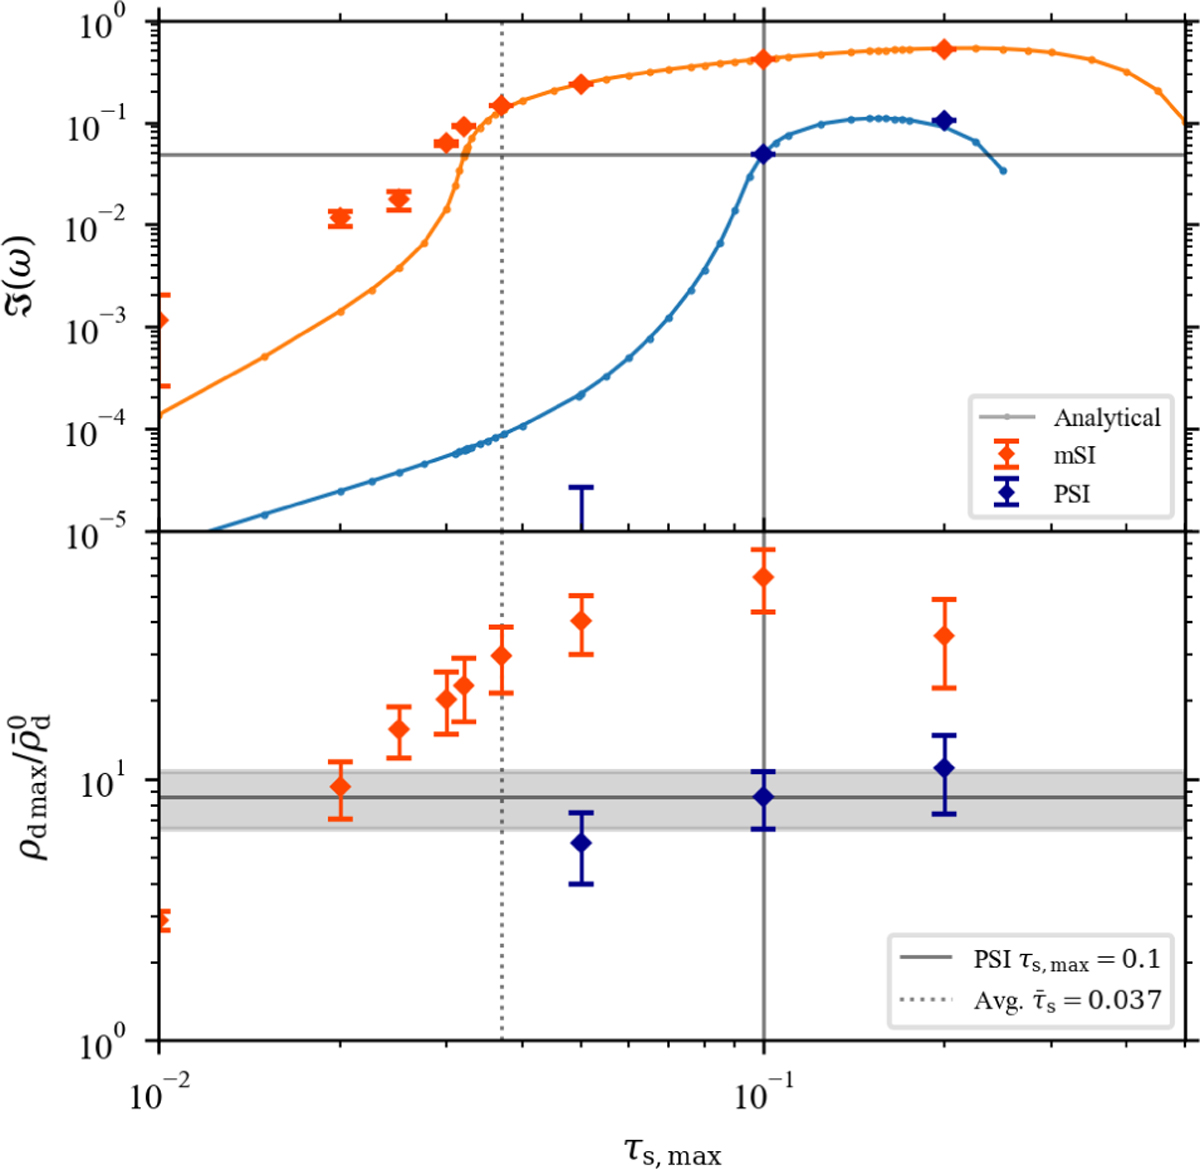
Efficientcy of dust compression as a function of Stokes number. The top plot shows the growth rate in the linear regime at wavevector K = (30, 0, 30)T for setups with different maximum Stokes numbers τs, max. The solid orange and blue lines are the analytical growth rates (for mSI and PSI, respectfully) calculated with psitools (McNally et al. 2021). The diamonds indicate the fitted values of the growth rate in the linear regime of the numerical simulations. In the bottom plot, the diamonds correspond to the fitted values of the saturated amplification factor of the maximum density in the non-linear regime. The solid grey lines indicate the values for run PSI10, and the dotted grey line indicates the average Stokes number of the size distribution of run PSI10.
Current usage metrics show cumulative count of Article Views (full-text article views including HTML views, PDF and ePub downloads, according to the available data) and Abstracts Views on Vision4Press platform.
Data correspond to usage on the plateform after 2015. The current usage metrics is available 48-96 hours after online publication and is updated daily on week days.
Initial download of the metrics may take a while.