Fig. 3
Download original image
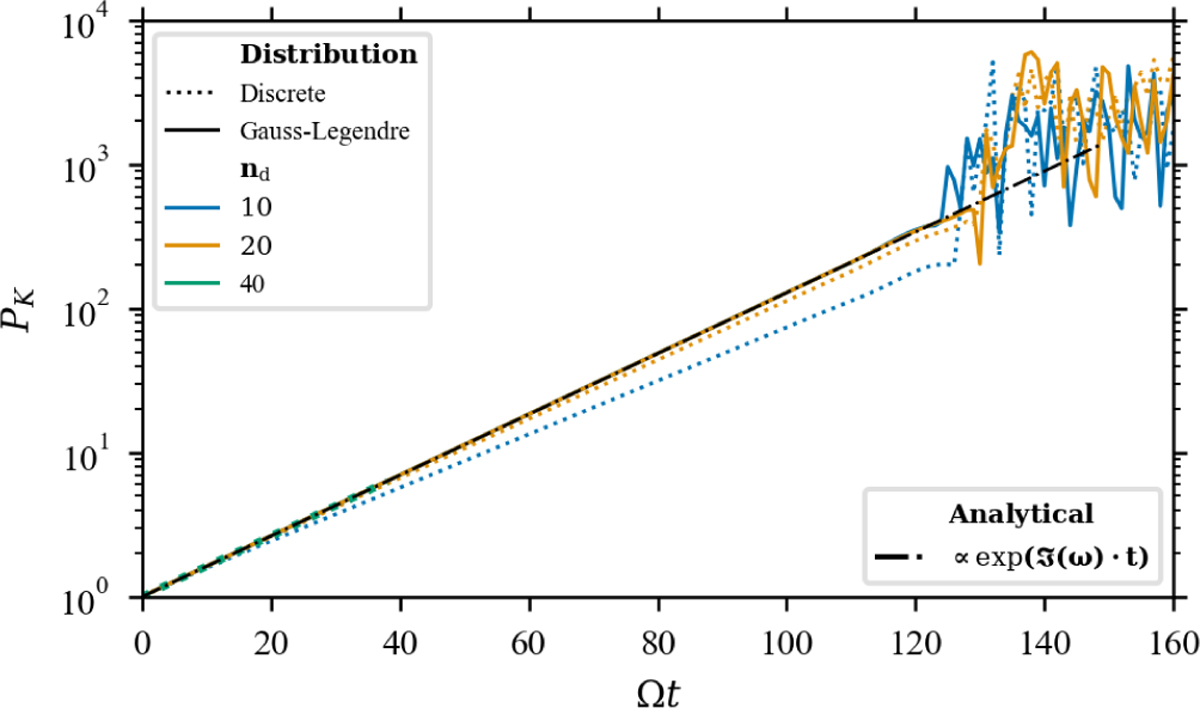
Normalised amplitude of the largest mode of the shearing box (a sinusoid with a wavenumber K=(30, 0, 30)T) for different numbers of dust species and sampling methods. The runs with ten dust species are shown in blue, 20 dust species are shown in orange, and 40 dust species are shown in green. The solid line indicates the GL method (27), and the dotted line indicates a log-linear sampling method (runs: PSI20, PSI10, PSI40disc., PSI20disc., and PSI10disc..). The dot-dashed line is an analytical solution of the growth rate calculated with psitools.
Current usage metrics show cumulative count of Article Views (full-text article views including HTML views, PDF and ePub downloads, according to the available data) and Abstracts Views on Vision4Press platform.
Data correspond to usage on the plateform after 2015. The current usage metrics is available 48-96 hours after online publication and is updated daily on week days.
Initial download of the metrics may take a while.