Fig. 2
Download original image
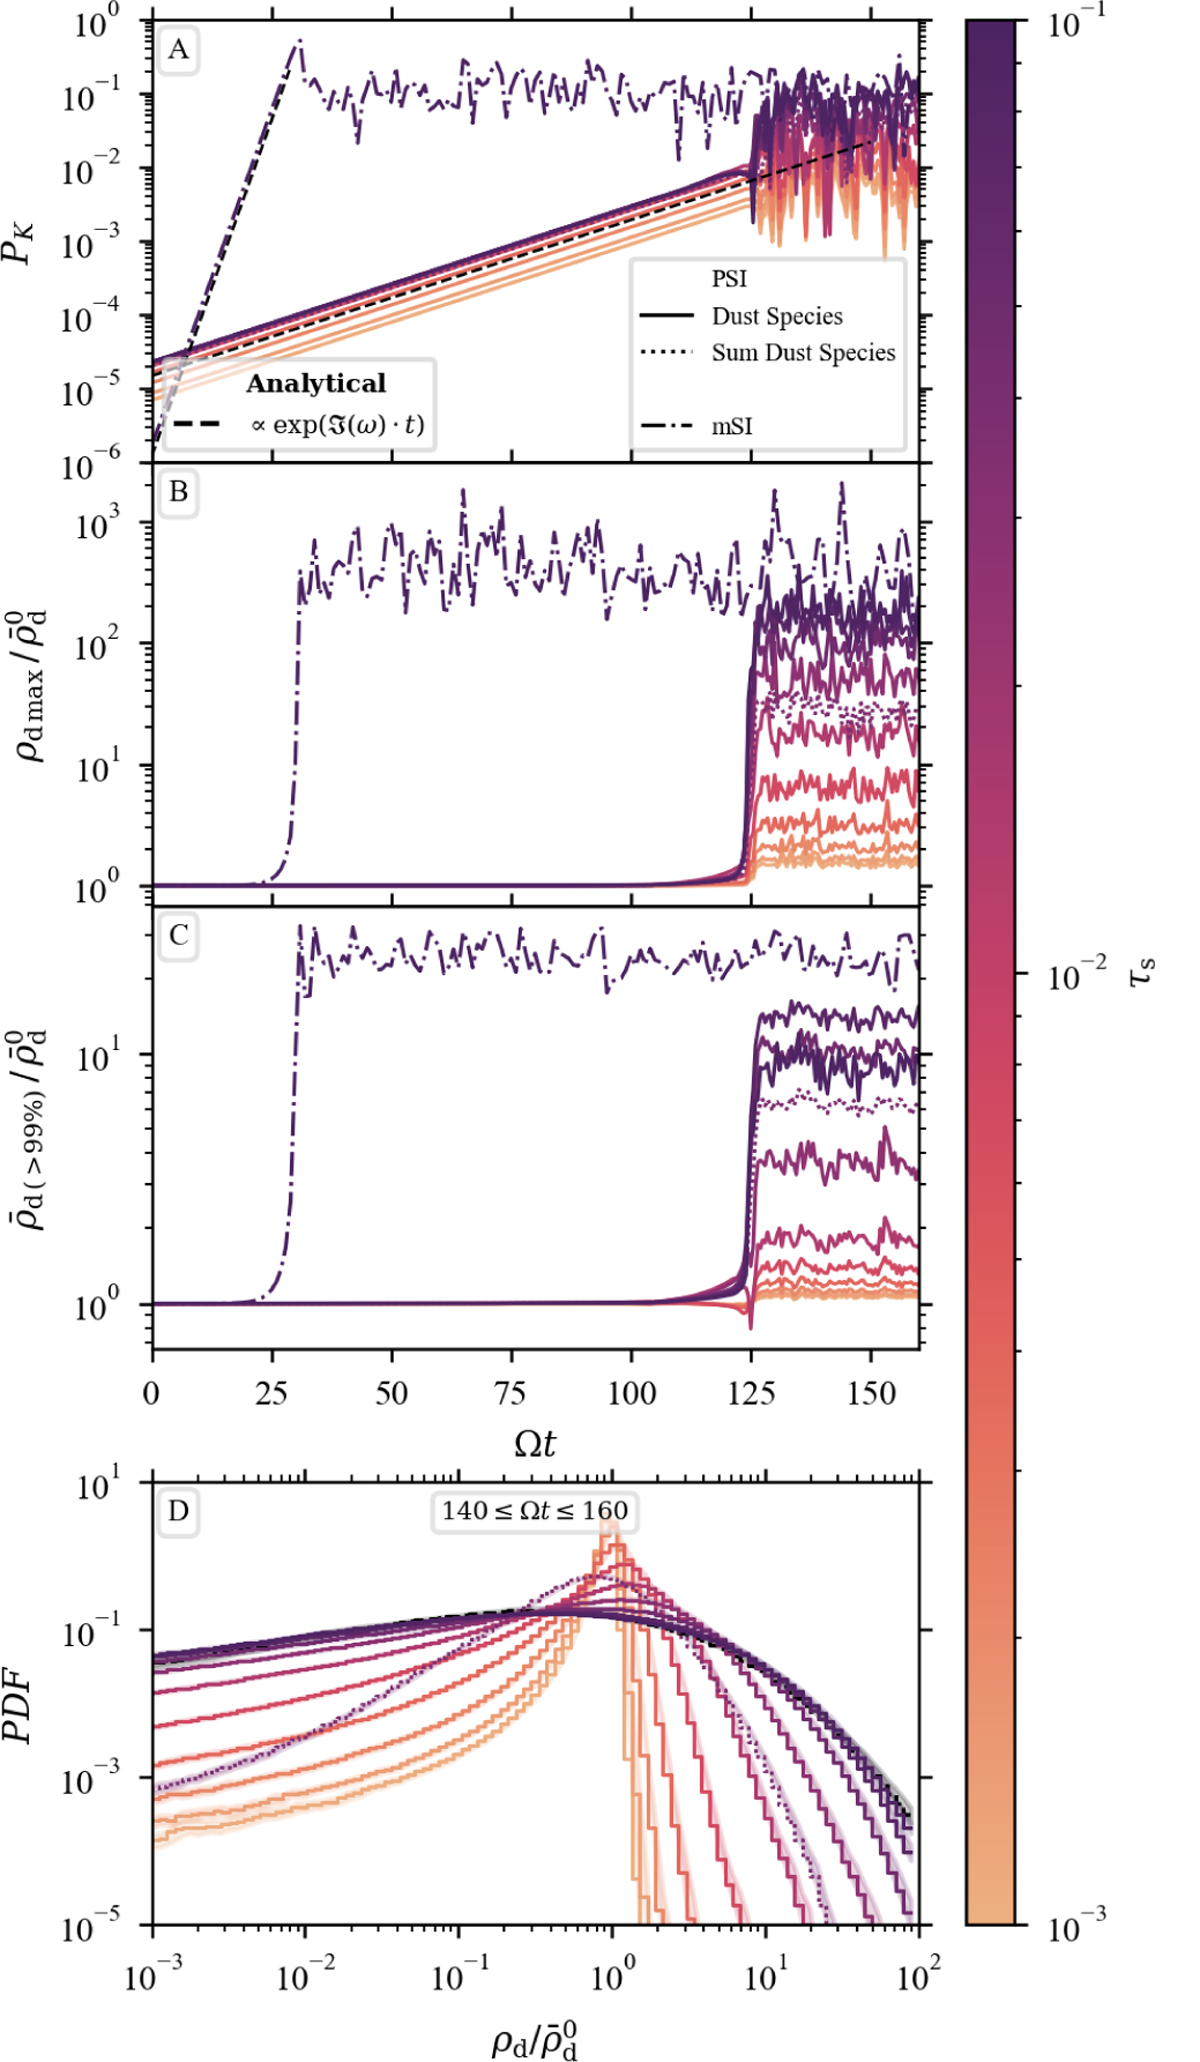
Time evolution of the mSI (run: mSI1024) and PSI (run: PSI101024). The dot-dashed line shows the mSI run, the solid lines show the ten individual dust species of the PSI run, and the dotted line is the sum over all the dust species. Plot A shows the amplitude of the largest mode in the shearing box (A sinusoid with wavenumber K = (30, 0, 30)T), plot B shows the maximum density in the shearing box, plot C shows the mean density at every snapshot's 99th percentile and plot D shows the average probability density function of the normalised density distribution in the non-linear regime between (140 ≤ Ωt ≤ 160).
Current usage metrics show cumulative count of Article Views (full-text article views including HTML views, PDF and ePub downloads, according to the available data) and Abstracts Views on Vision4Press platform.
Data correspond to usage on the plateform after 2015. The current usage metrics is available 48-96 hours after online publication and is updated daily on week days.
Initial download of the metrics may take a while.