Open Access
Fig. 19
Download original image
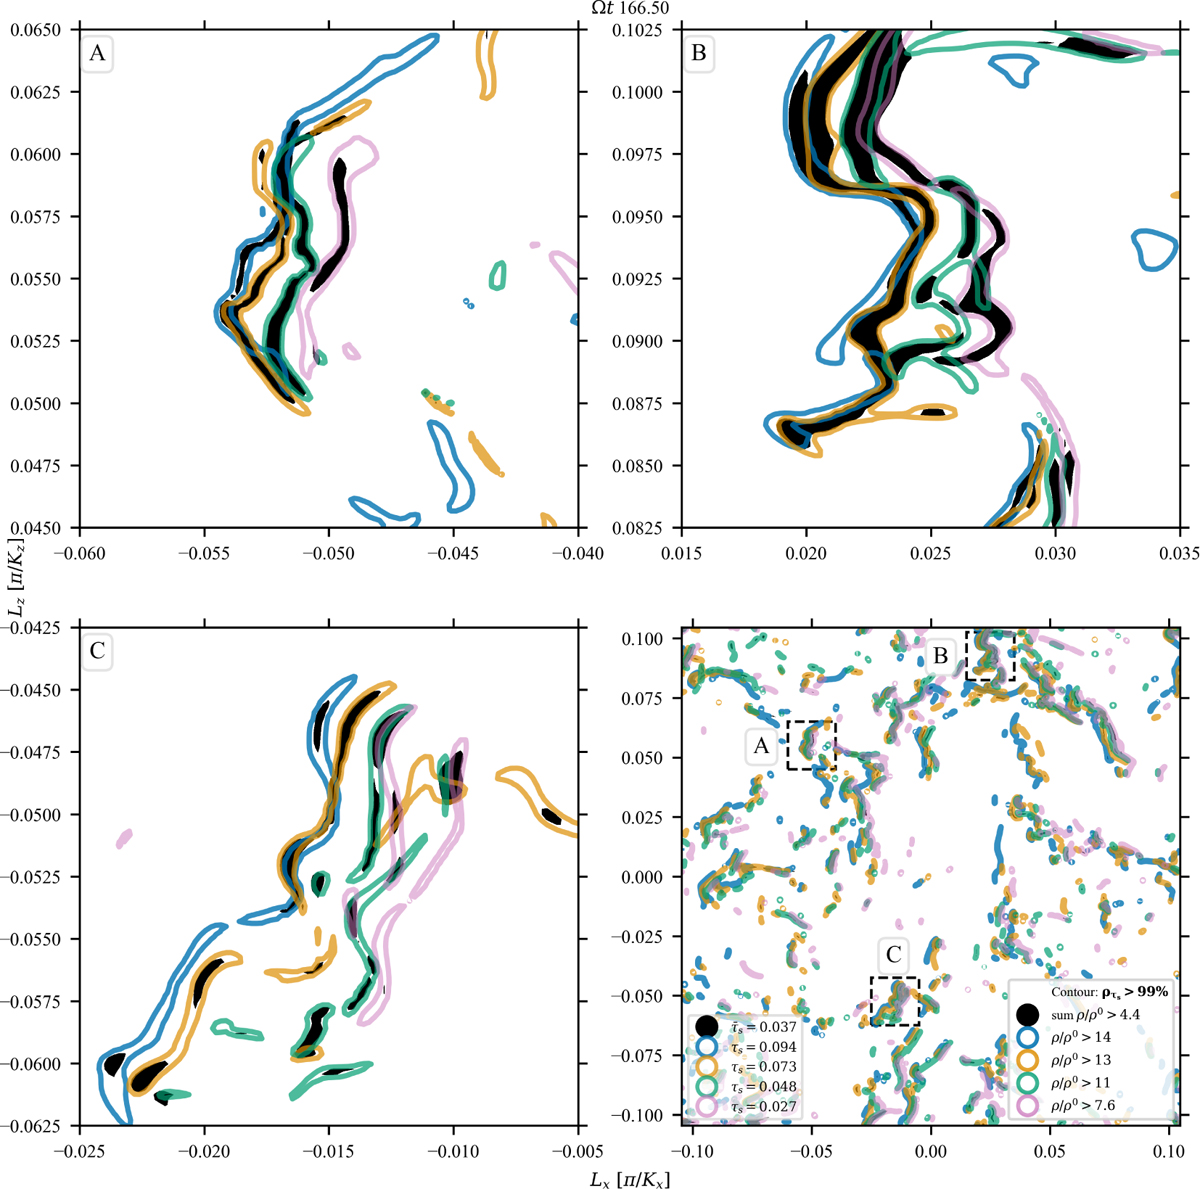
Contour of density at the upper 99th percentile for the sum of the density and the dust bins of the four largest Stokes numbers. The figure shows the substructure of the clumps in the non-linear regime (snapshot at Ωt = 166.5) for the PSI (run PSI101024).
Current usage metrics show cumulative count of Article Views (full-text article views including HTML views, PDF and ePub downloads, according to the available data) and Abstracts Views on Vision4Press platform.
Data correspond to usage on the plateform after 2015. The current usage metrics is available 48-96 hours after online publication and is updated daily on week days.
Initial download of the metrics may take a while.