Fig. 11
Download original image
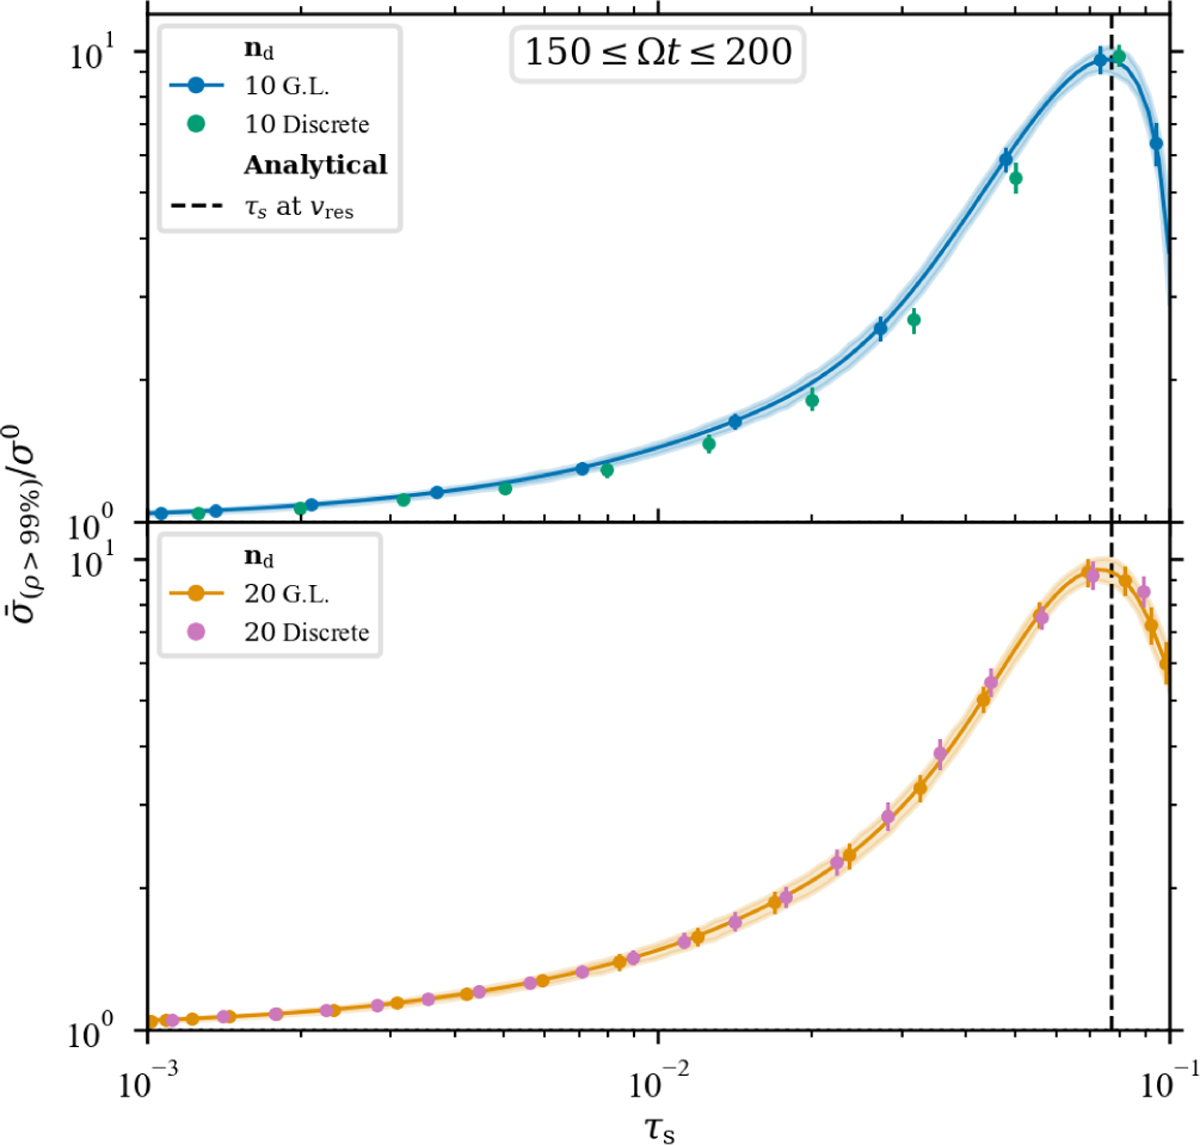
Normalised mean size distribution at the 99th percentile and between 150 ≤ Ωt ≤ 200. The top plot shows the PSI run with ten dust species sampled from the GL in blue (run PSI10) and the PSI run with ten dust species uniformly sampled from a logarithmic scale in green (run PSI10disc.), and the bottom plot shows the PSI run using 20 dust species sampled from the GL in orange (run PSI20) and the PSI run with 20 dust species uniformly sampled from a logarithmic scale in pink (run PSI2 θdisc.).
Current usage metrics show cumulative count of Article Views (full-text article views including HTML views, PDF and ePub downloads, according to the available data) and Abstracts Views on Vision4Press platform.
Data correspond to usage on the plateform after 2015. The current usage metrics is available 48-96 hours after online publication and is updated daily on week days.
Initial download of the metrics may take a while.