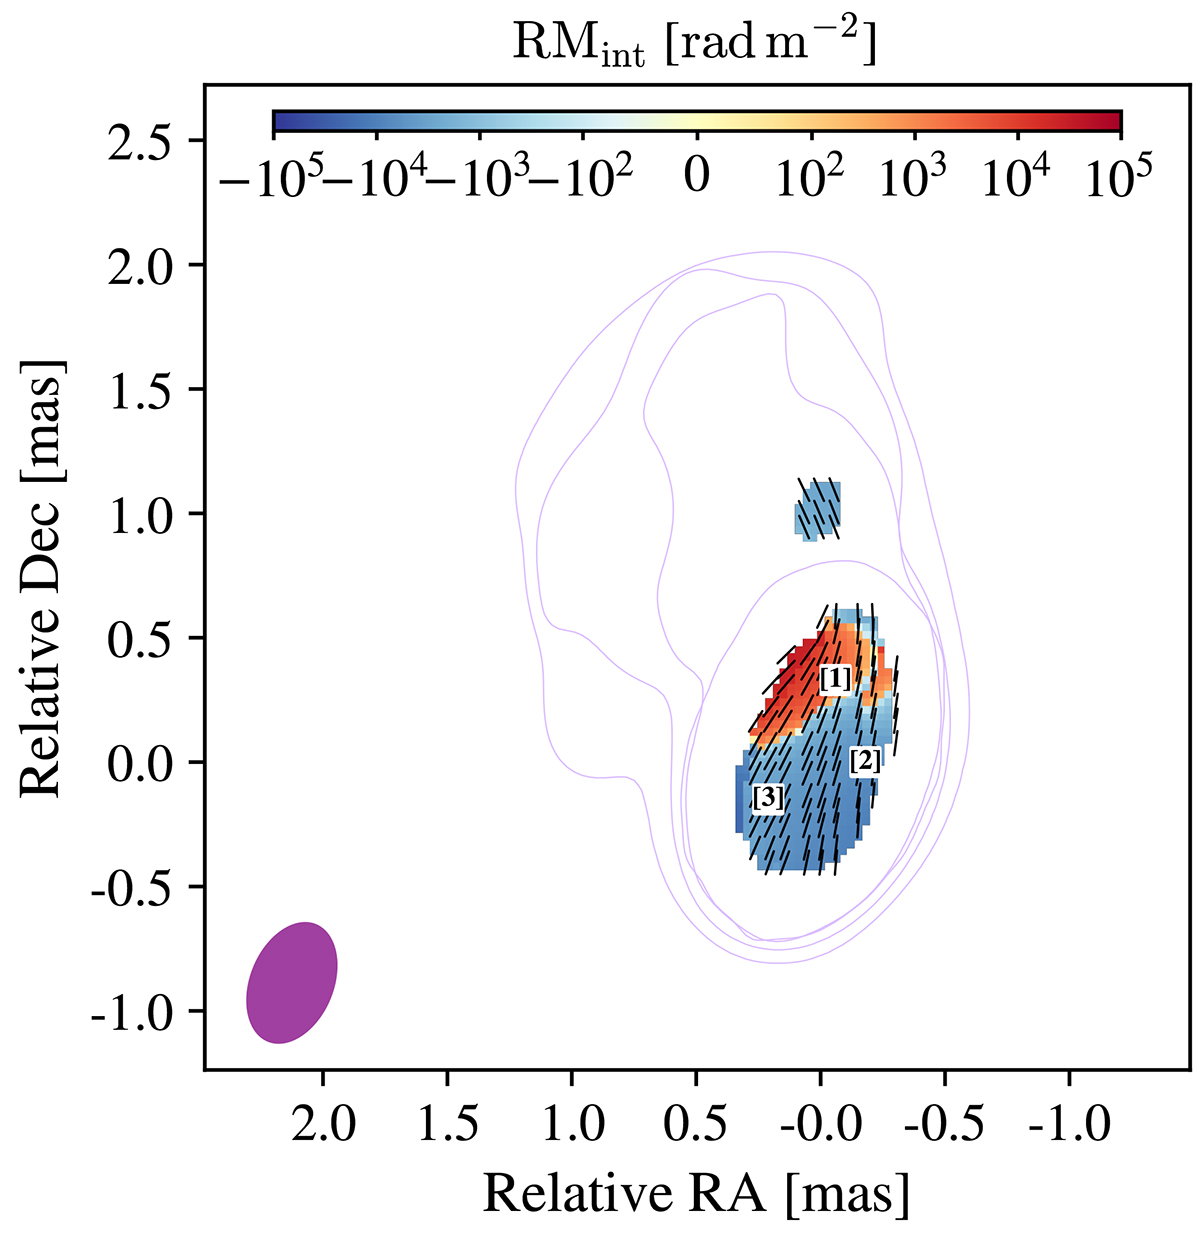
Fig. 3.
Download original image
Map of RMint and EVPA0. The tick markers show the average EVPA0 across a 3 × 3 pixel region. The contours are the lowest Stokes I contour levels for all frequencies from Fig. 1. The observed EVPA against λ2 for the three pixels marked by numbers 1,2 and 3 are plotted in Fig. 4. The purple ellipse in panel shows the restoring beam used for all four frequencies.
Current usage metrics show cumulative count of Article Views (full-text article views including HTML views, PDF and ePub downloads, according to the available data) and Abstracts Views on Vision4Press platform.
Data correspond to usage on the plateform after 2015. The current usage metrics is available 48-96 hours after online publication and is updated daily on week days.
Initial download of the metrics may take a while.