Fig. 1.
Download original image
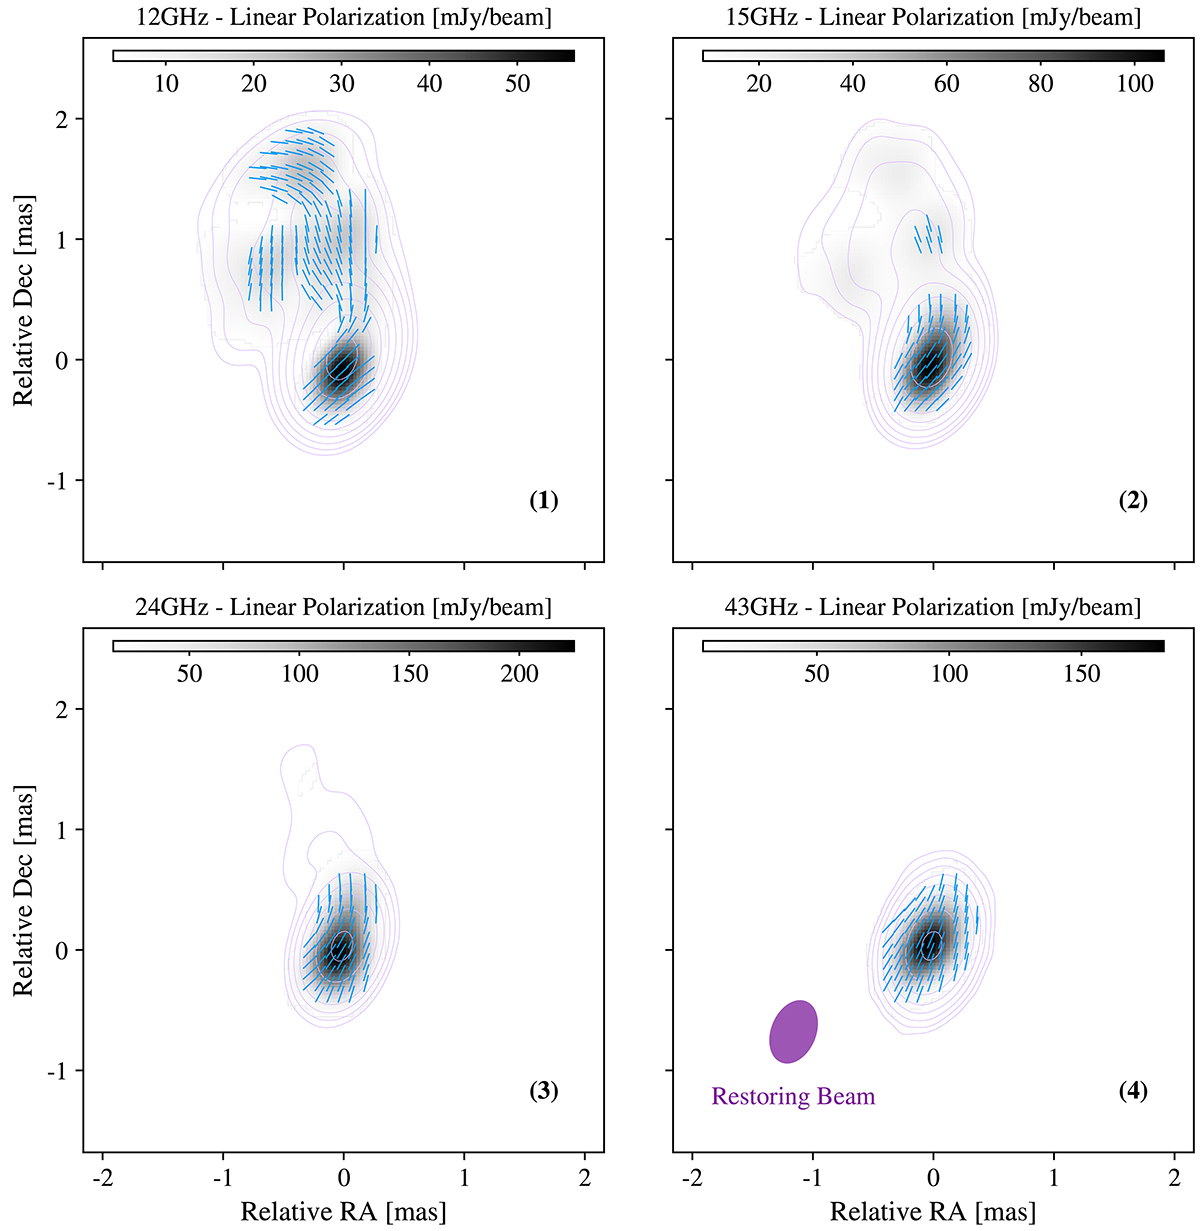
Panels (1) to (4) show the Stokes I contours and linear polarization intensity (shown in gray-scale) of NRAO 150 for 12 (1), 15 (2), 24 (3), and 43 GHz (4). The purple ellipse in panel (4) shows the restoring beam used for all four frequencies. The contours start at 5σI up to the peak increasing by a factor of 2. The blue ticks in panels (1) to (4) show the average EVPA across a 5 × 5 pixel region for each frequency.
Current usage metrics show cumulative count of Article Views (full-text article views including HTML views, PDF and ePub downloads, according to the available data) and Abstracts Views on Vision4Press platform.
Data correspond to usage on the plateform after 2015. The current usage metrics is available 48-96 hours after online publication and is updated daily on week days.
Initial download of the metrics may take a while.