Fig. 7
Download original image
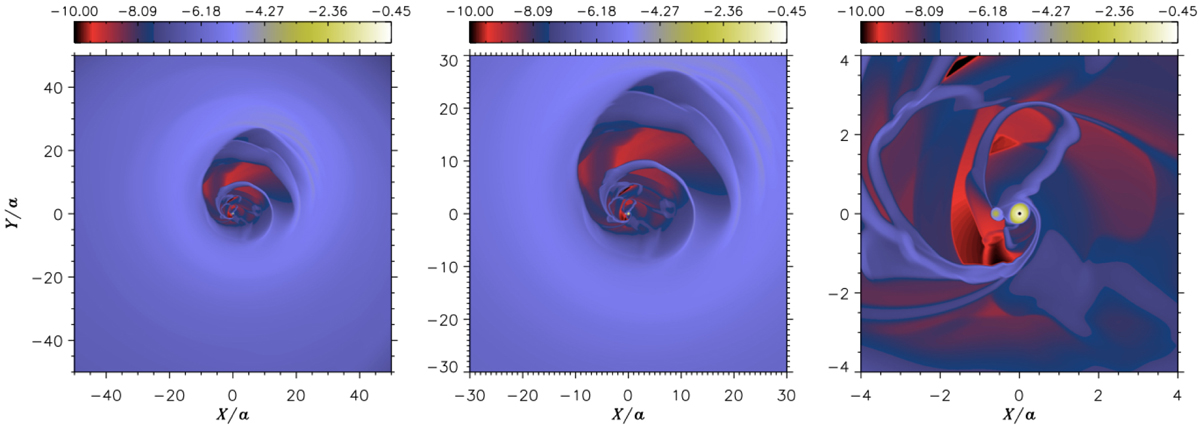
Logarithm of the gas surface density in the high-viscosity model, at time t = 3300 T. As for the base model, the simulation uses overlapping polar grids that extend out to 144 a. The left and centre panels show the circumbinary disc, whereas the right panel shows the circumprimary disc. The secondary star is located at the pericentre of its orbit. The colour bar represents Σ in units of MA/a2. For the adopted system parameters, a density of 10−2 corresponds to ≈310 g cm−2.
Current usage metrics show cumulative count of Article Views (full-text article views including HTML views, PDF and ePub downloads, according to the available data) and Abstracts Views on Vision4Press platform.
Data correspond to usage on the plateform after 2015. The current usage metrics is available 48-96 hours after online publication and is updated daily on week days.
Initial download of the metrics may take a while.