Fig. 4
Download original image
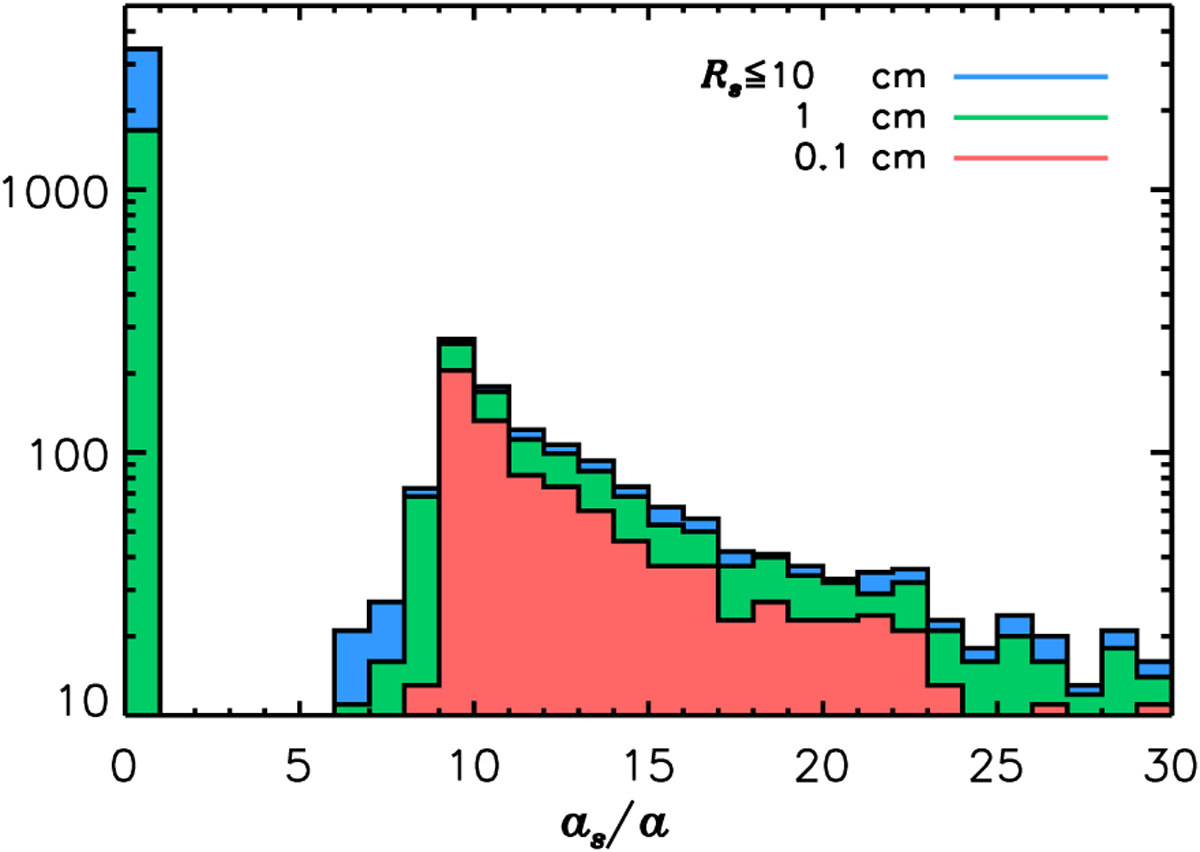
Histogram of the semi-major axis of particles with different radii, as indicated in the legend. The histograms are stacked in order of increasing size: the red histogram includes particles Rs = 1 mm, the green histogram includes particles Rs ≤ 1 cm, and the blue histogram includes all particles. All solids start from beyond 20 a, and only the larger particles drift towards the circumprimary disc. The results shown refer to the base model.
Current usage metrics show cumulative count of Article Views (full-text article views including HTML views, PDF and ePub downloads, according to the available data) and Abstracts Views on Vision4Press platform.
Data correspond to usage on the plateform after 2015. The current usage metrics is available 48-96 hours after online publication and is updated daily on week days.
Initial download of the metrics may take a while.