Fig. 3
Download original image
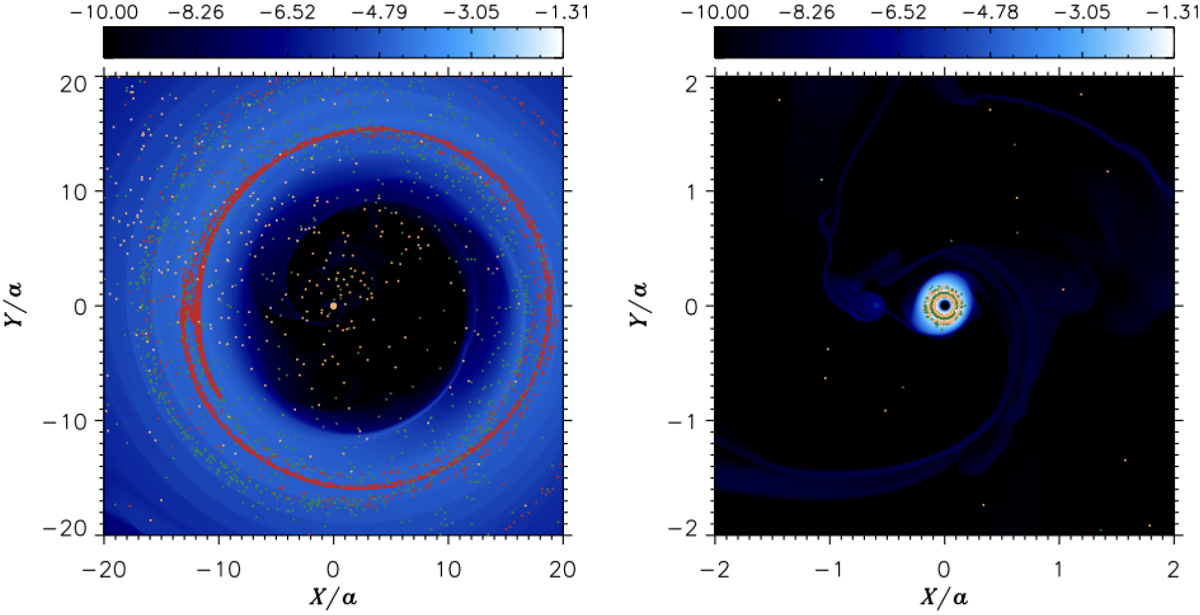
Logarithm of the gas surface density in the base model with the particle positions superimposed: 1 mm (red), 1 cm (green), 10 cm (orange). All particles are initially located beyond 20 a. The panels show the gap region, its surroundings (left), and the circumprimary disc (right). The smallest particles do not cross the gap region to reach the circumprimary disc, whereas the larger particles do. The secondary star is at apocentre. The colour bar represents Σ in units of MA/a2.
Current usage metrics show cumulative count of Article Views (full-text article views including HTML views, PDF and ePub downloads, according to the available data) and Abstracts Views on Vision4Press platform.
Data correspond to usage on the plateform after 2015. The current usage metrics is available 48-96 hours after online publication and is updated daily on week days.
Initial download of the metrics may take a while.