Fig. 4
Download original image
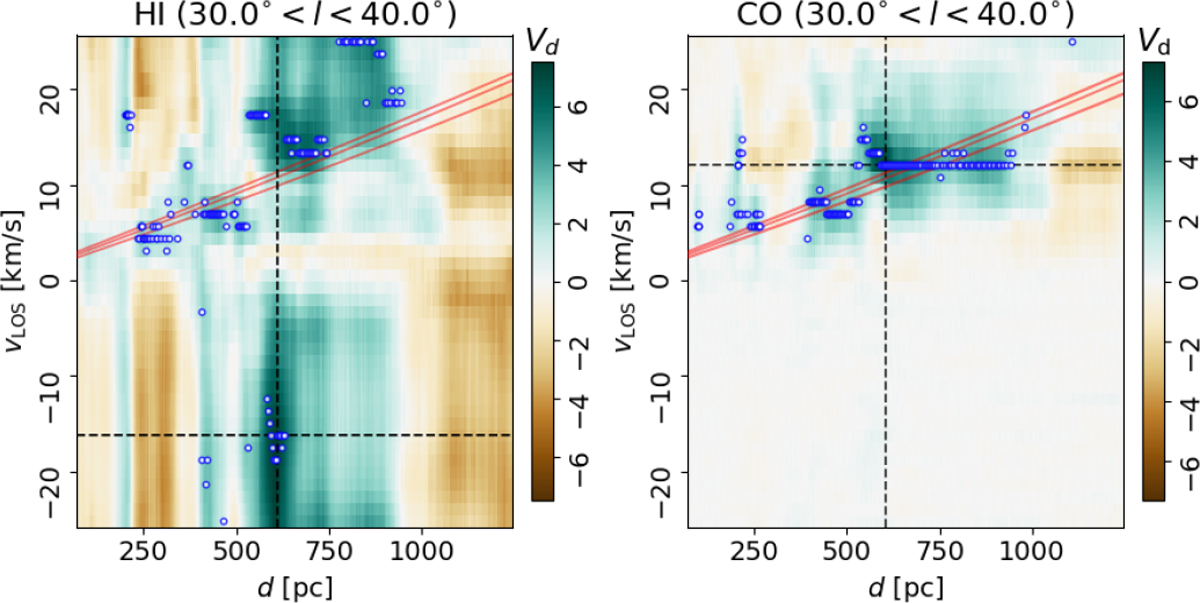
Example of the HOG method morphological correlation between the 3D dust density reconstruction and the line emission observations for the region 30° < l < 40° and |b| < 5°. Each panel corresponds to the correlation between distance channels, from the 3D dust density, and velocity channels, from the H I and CO line emission, shown in the left and right panels, respectively. The correlation metric is the direction-sensitive projected Rayleigh statistic (Vd, Eq. (2)). Values of Vd ≈ 0 correspond to a random orientation between the gradients of the two tracers, thus indicating low morphological correlation. Values of Vd > 2.87 correspond to mostly parallel gradients, thus indicating a significant morphological correlation. Values of Vd < 2.87 correspond to mostly antiparallel gradients. The white markers indicate the vLOS with the highest Vd for each distance channel. The green dashed lines correspond to the distance and vLOS with the highest Vd for the whole velocity and distance ranges. The three cyan lines represent the kinematic distances for the Galactic longitude at the center and the region’s edges, according to the Reid et al. (2019) Galactic rotation model.
Current usage metrics show cumulative count of Article Views (full-text article views including HTML views, PDF and ePub downloads, according to the available data) and Abstracts Views on Vision4Press platform.
Data correspond to usage on the plateform after 2015. The current usage metrics is available 48-96 hours after online publication and is updated daily on week days.
Initial download of the metrics may take a while.