Fig. 3
Download original image
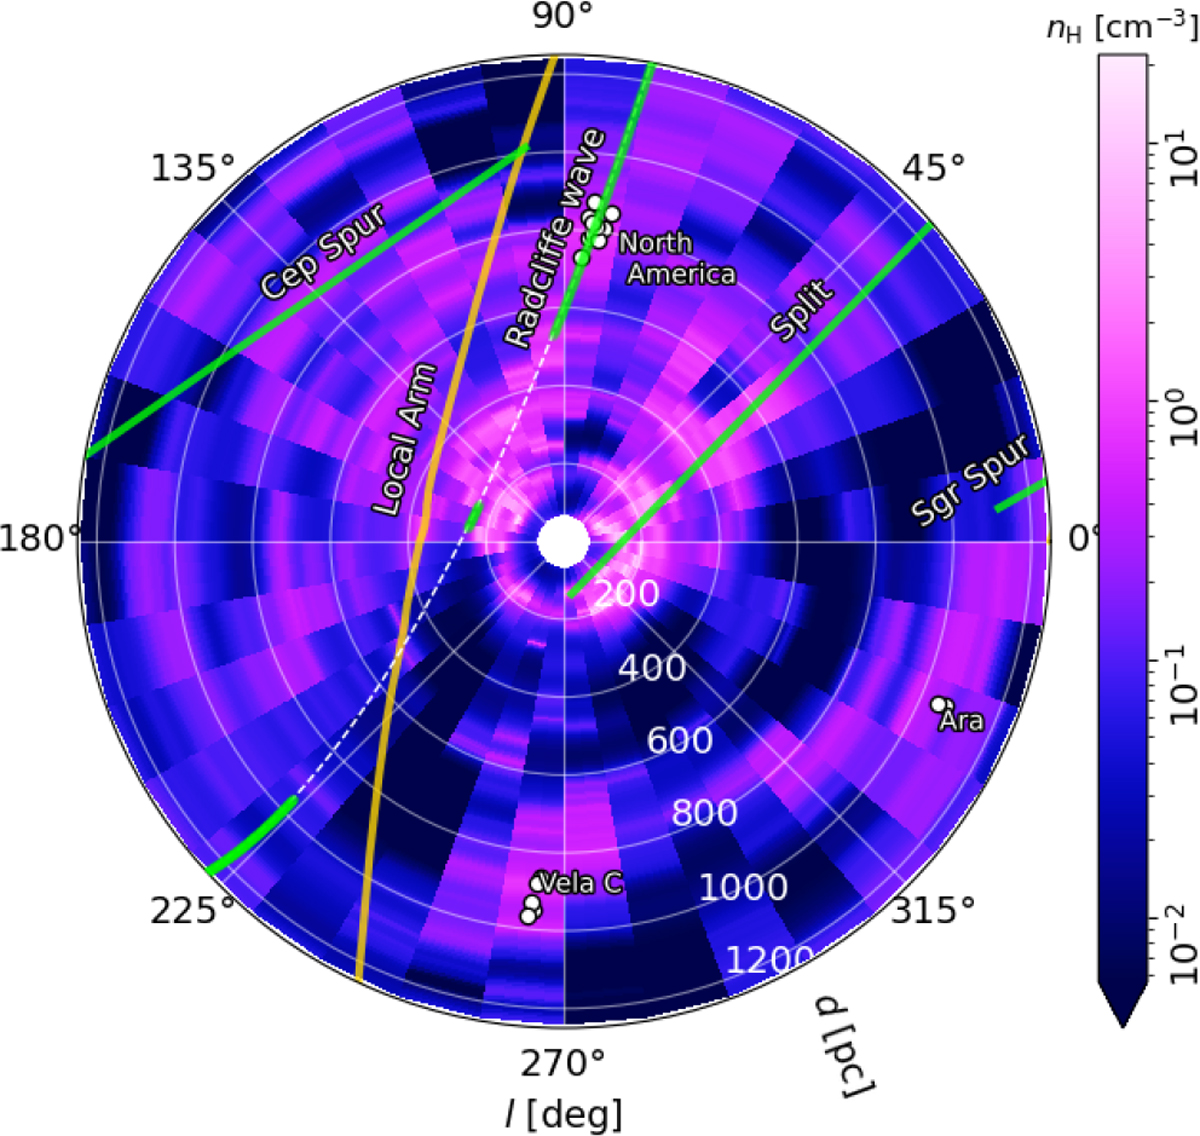
Heliocentric distribution of the mean nucleon density derived from the 3D dust extinction models presented in Edenhofer et al. (2024) for the sky region |b| ≤ 5°. The superimposed curves indicate large-scale features in the Solar neighborhood, as reported in Zucker et al. (2023). For the Radcliffe Wave, we indicate the full extent of the structure with the dashed white line and the segments within |b| ≤ 5° in green. The white disks indicate the locations of MC complexes referenced in the text.
Current usage metrics show cumulative count of Article Views (full-text article views including HTML views, PDF and ePub downloads, according to the available data) and Abstracts Views on Vision4Press platform.
Data correspond to usage on the plateform after 2015. The current usage metrics is available 48-96 hours after online publication and is updated daily on week days.
Initial download of the metrics may take a while.