Fig. 1
Download original image
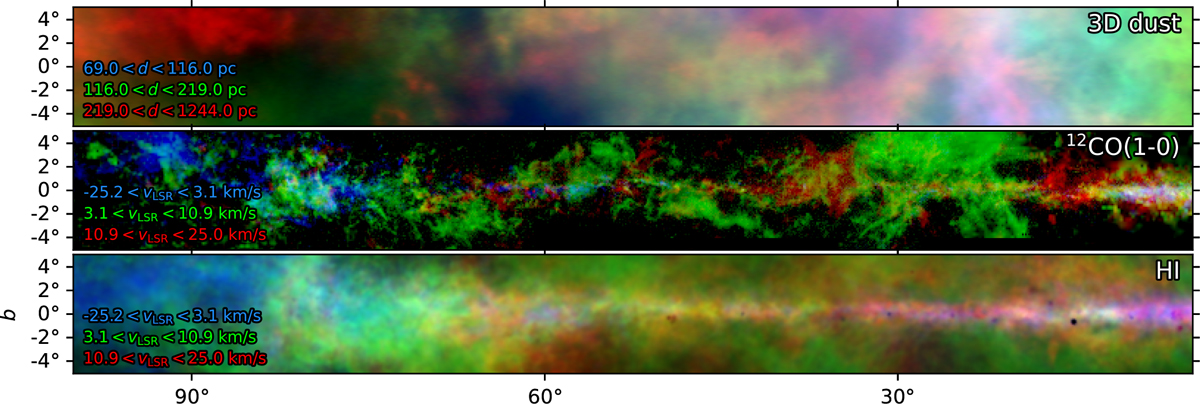
Examples of the 3D dust, 12CO, and H I data combined in this paper. Top: Nucleon density derived from the 3D extinction model presented by Edenhofer et al. (2024) for three distance bins indicated in the figure. Middle: 12CO line emission from the Dame et al. (2001) survey for the three LOS velocity intervals indicated in the figure. Bottom: H I 21-cm line emission observations presented by HI4PI Collaboration (2016).
Current usage metrics show cumulative count of Article Views (full-text article views including HTML views, PDF and ePub downloads, according to the available data) and Abstracts Views on Vision4Press platform.
Data correspond to usage on the plateform after 2015. The current usage metrics is available 48-96 hours after online publication and is updated daily on week days.
Initial download of the metrics may take a while.