Fig. 3
Download original image
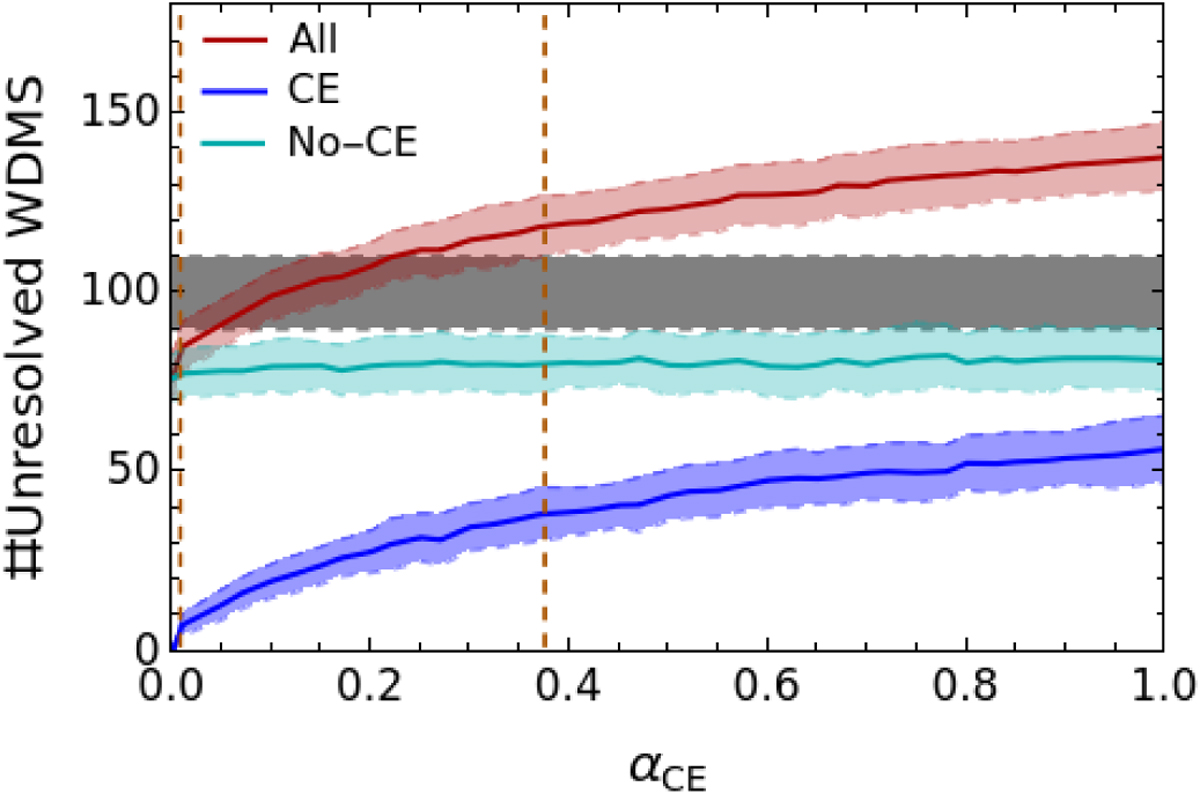
Number of unresolved WDMS systems as a function of the αCE parameter for binary systems in the WDMS region (red), showing also how many have undergone a common-envelope episode (blue) and how many have not (green). The vertical dashed orange lines show the lower and upper limits of αCE compatible with the observed value (gray).
Current usage metrics show cumulative count of Article Views (full-text article views including HTML views, PDF and ePub downloads, according to the available data) and Abstracts Views on Vision4Press platform.
Data correspond to usage on the plateform after 2015. The current usage metrics is available 48-96 hours after online publication and is updated daily on week days.
Initial download of the metrics may take a while.