Fig. 8.
Download original image
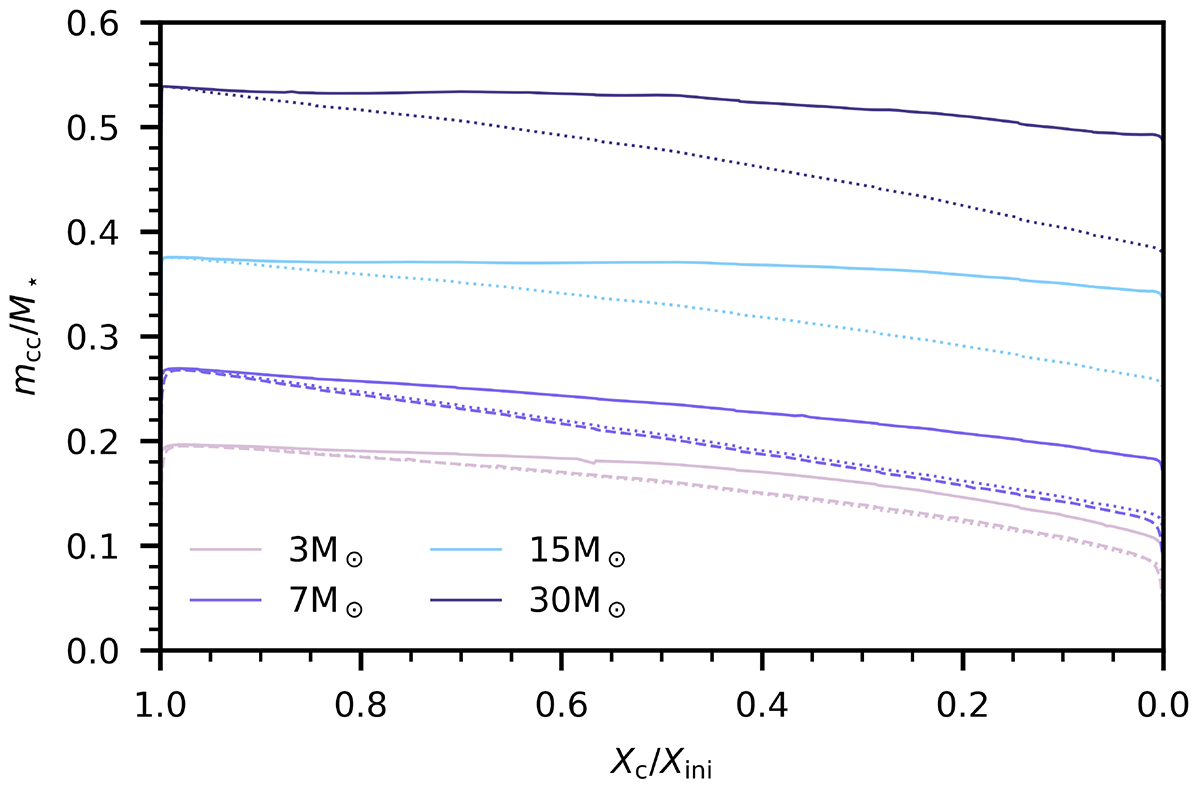
Predicted evolution of the convective core mass for models with IGW mixing and Z = 0.02. The solid lines correspond to models where the value of A has been set according to Eq. (7). The dotted lines indicate the lowest values per mass considered in Fig. 3. The two dashed lines indicate models with fCBM = 0.005 instead of 0.02, where A = 2 · 10−4 s for 3 M⊙ and A = 5 · 10−4 s for 7 M⊙. In the case of the 3 M⊙ model, the dotted and dashed lines coincide on the plot.
Current usage metrics show cumulative count of Article Views (full-text article views including HTML views, PDF and ePub downloads, according to the available data) and Abstracts Views on Vision4Press platform.
Data correspond to usage on the plateform after 2015. The current usage metrics is available 48-96 hours after online publication and is updated daily on week days.
Initial download of the metrics may take a while.