Open Access
Fig. 7.
Download original image
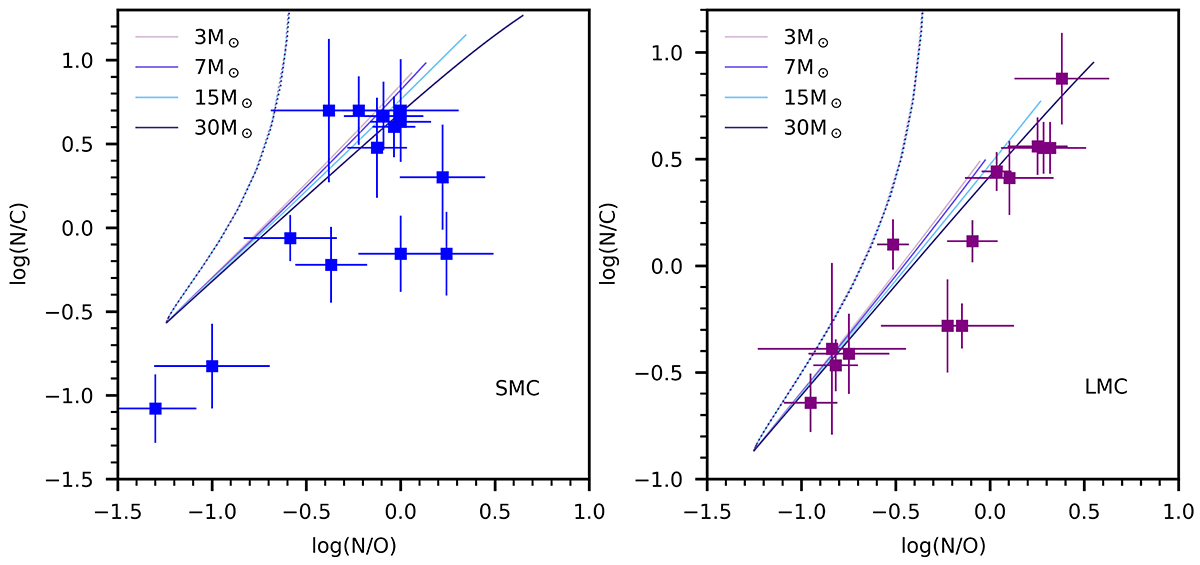
Predicted coverage of the ratios N/O and N/C at the surface (solid lines) for models with IGW mixing. In this diagram, stars evolve from the lower left corner to the upper right corner. Data points indicate the measurements from Martins et al. (2024). The dotted lines indicate the ratios in the convective core.
Current usage metrics show cumulative count of Article Views (full-text article views including HTML views, PDF and ePub downloads, according to the available data) and Abstracts Views on Vision4Press platform.
Data correspond to usage on the plateform after 2015. The current usage metrics is available 48-96 hours after online publication and is updated daily on week days.
Initial download of the metrics may take a while.