Fig. B.2
Download original image
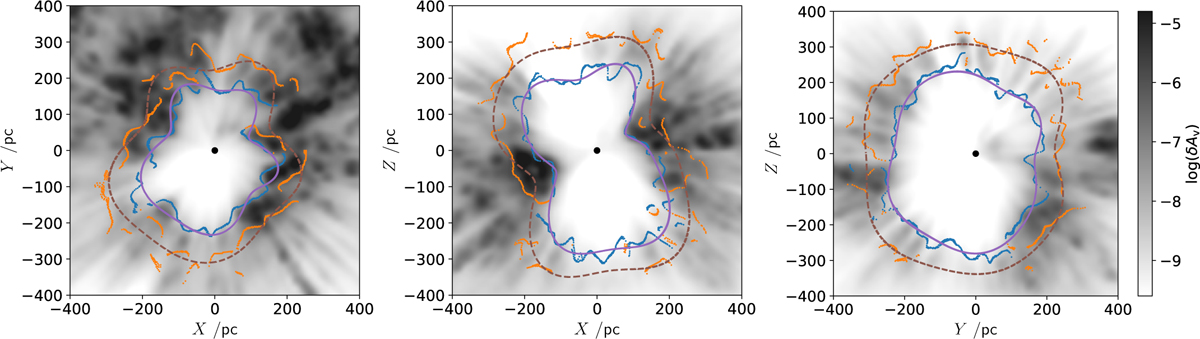
Crosscuts along the planes XY, XZ, and YZ in the 3D dust extinction map of Lallement et al. (2019). We use the Heliocentric Galactic coordinates. The (common) gray scale shows log(δAv), with δAv the differential of the dust extinction in units of magnitude per parsec. The blue and orange dots mark the inner and outer surfaces of the Local Bubble shell measured from the radial profiles of δAv. The purple and brown continuous lines trace the intersection of our models for ![]() and
and ![]() with the respective plane, respectively.
with the respective plane, respectively.
Current usage metrics show cumulative count of Article Views (full-text article views including HTML views, PDF and ePub downloads, according to the available data) and Abstracts Views on Vision4Press platform.
Data correspond to usage on the plateform after 2015. The current usage metrics is available 48-96 hours after online publication and is updated daily on week days.
Initial download of the metrics may take a while.