Fig. 7
Download original image
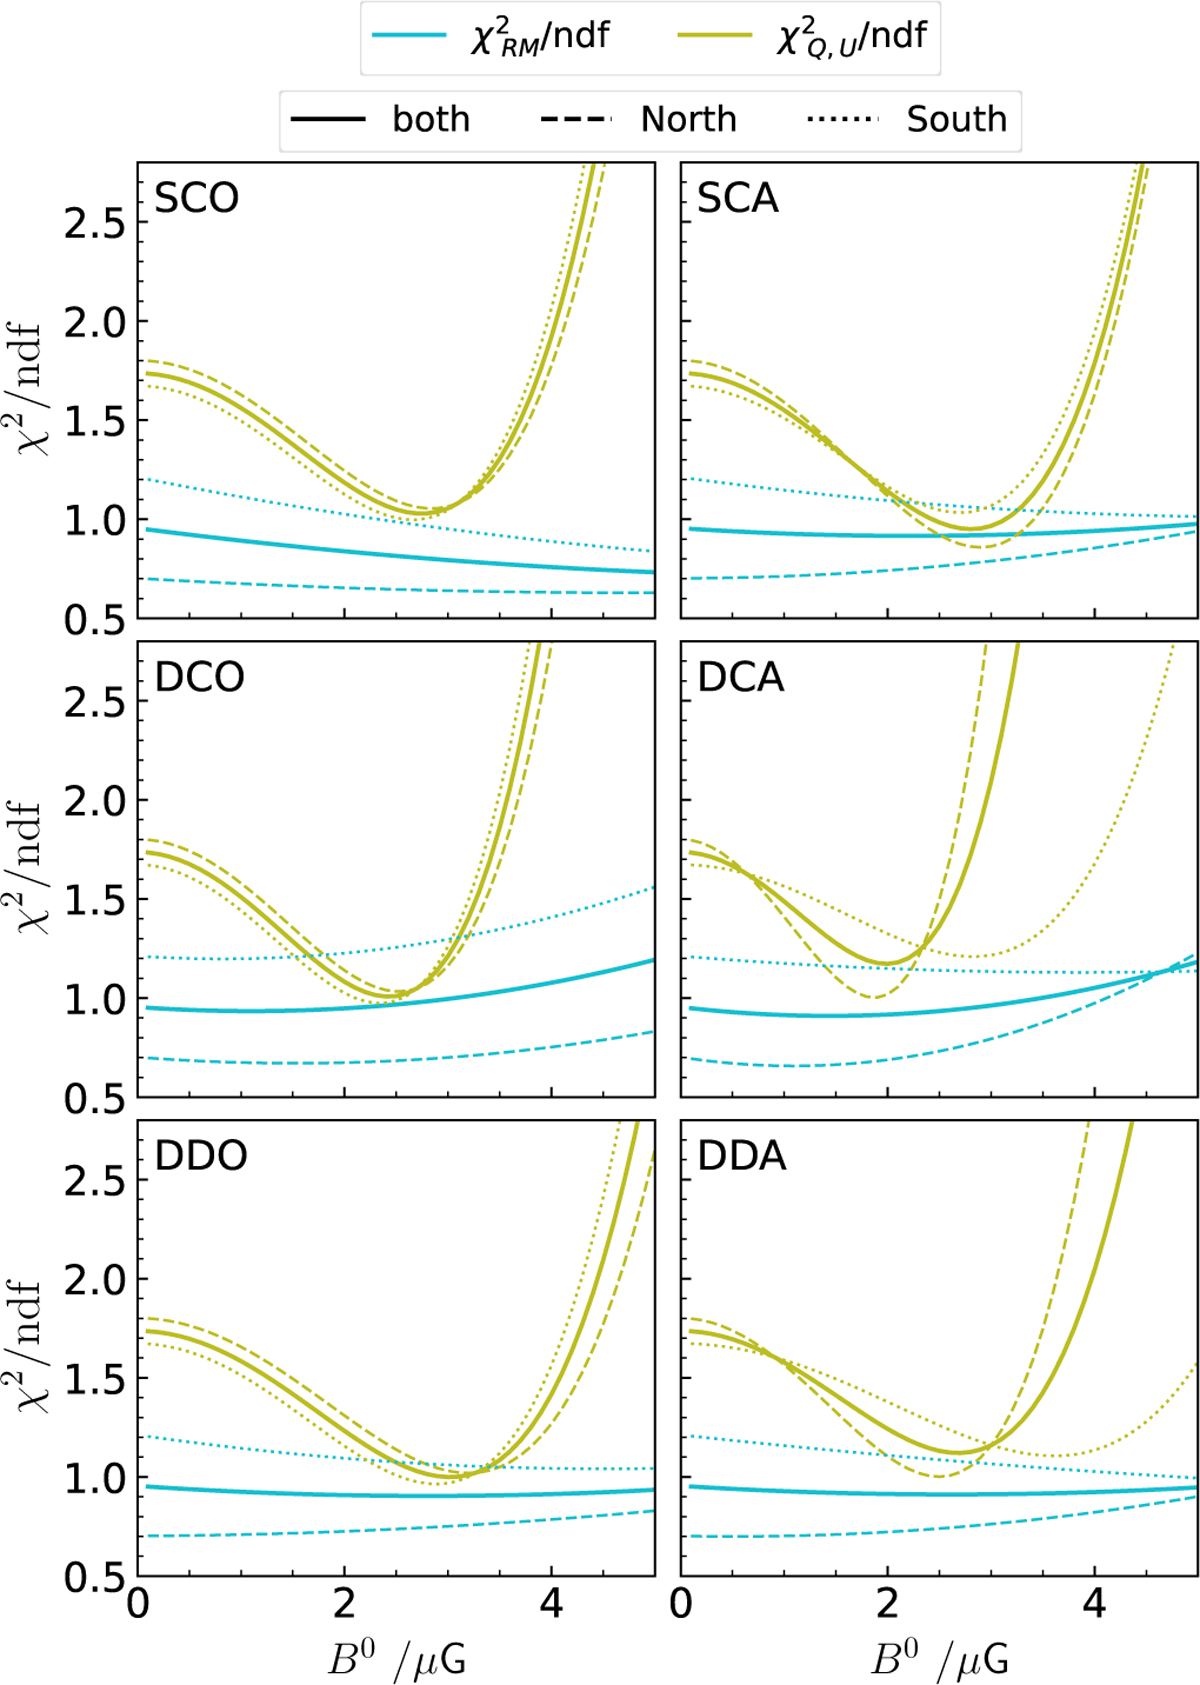
Contribution to the reduced χ2 of the different observables as a function of the strength of the initial magnetic field for the six scenarios. The contribution from Q and U are combined. The contributions from the northern and southern hemispheres are also shown with dashed and dotted lines, respectively.
Current usage metrics show cumulative count of Article Views (full-text article views including HTML views, PDF and ePub downloads, according to the available data) and Abstracts Views on Vision4Press platform.
Data correspond to usage on the plateform after 2015. The current usage metrics is available 48-96 hours after online publication and is updated daily on week days.
Initial download of the metrics may take a while.