Fig. 6
Download original image
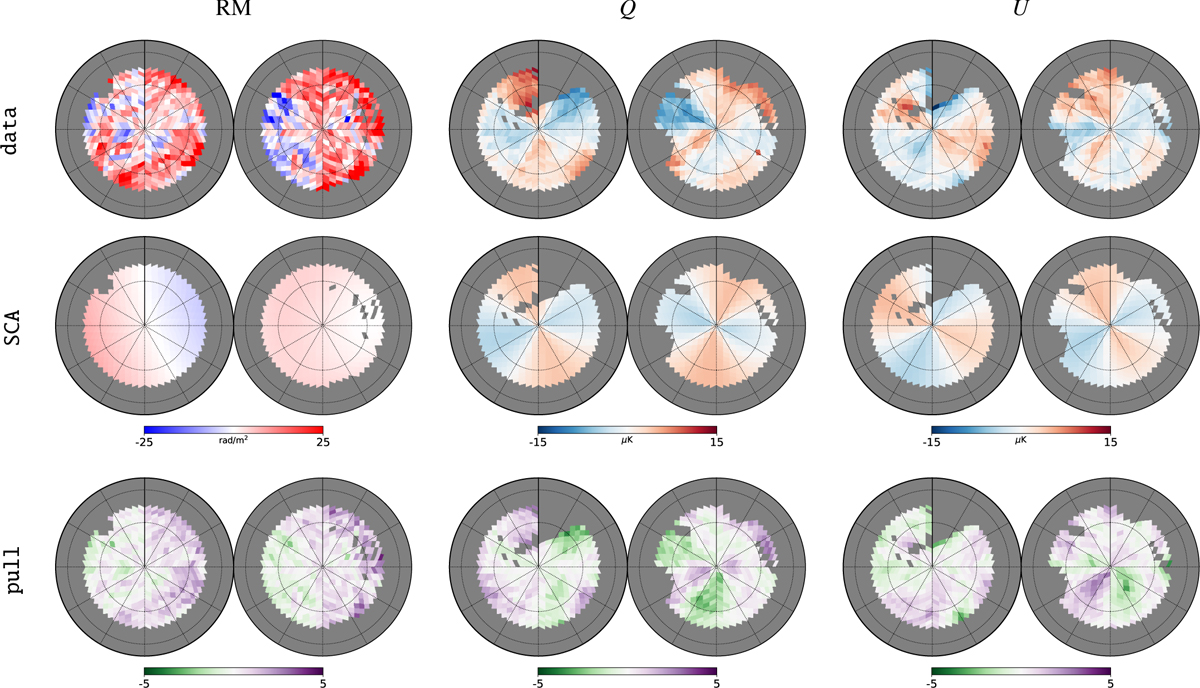
Orthographic projection of the same data used in Unger & Farrar (2024) (top), the model predictions for the SCA scenario (middle), and pulls (bottom). The gray area is masked out as explained in the text. The north pole is at the center of the left disk and the south pole to the right. The longitude zero is marked by the vertical thick lines starting from the poles upward. Longitude increases clockwise on the left and counterclockwise on the right.
Current usage metrics show cumulative count of Article Views (full-text article views including HTML views, PDF and ePub downloads, according to the available data) and Abstracts Views on Vision4Press platform.
Data correspond to usage on the plateform after 2015. The current usage metrics is available 48-96 hours after online publication and is updated daily on week days.
Initial download of the metrics may take a while.