Fig. 5
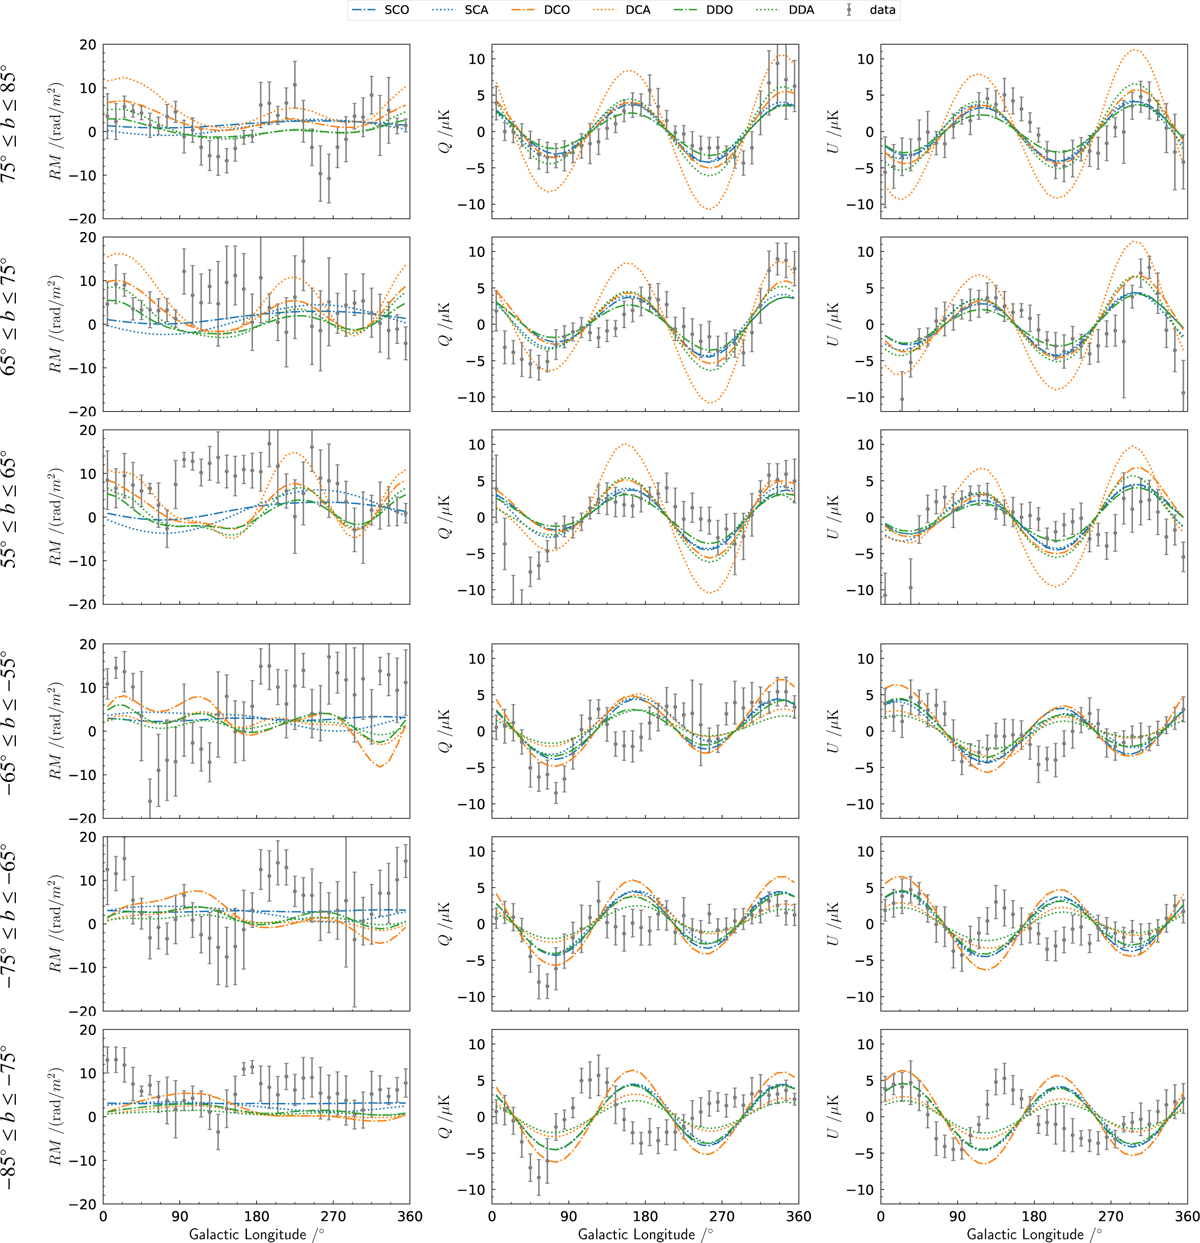
Download original image
Longitude profiles for constant latitude stripes of 10° width for |b| ∈ [55°, 85°], as described in the text. Predictions for the different scenarios for the Local Bubble magnetic field are shown as continuous lines according to the legend, for the RM, Q, and U signal (from left to right). For reference, observational data is also shown as gray points with symmetric errorbars.
Current usage metrics show cumulative count of Article Views (full-text article views including HTML views, PDF and ePub downloads, according to the available data) and Abstracts Views on Vision4Press platform.
Data correspond to usage on the plateform after 2015. The current usage metrics is available 48-96 hours after online publication and is updated daily on week days.
Initial download of the metrics may take a while.