Fig. 4
Download original image
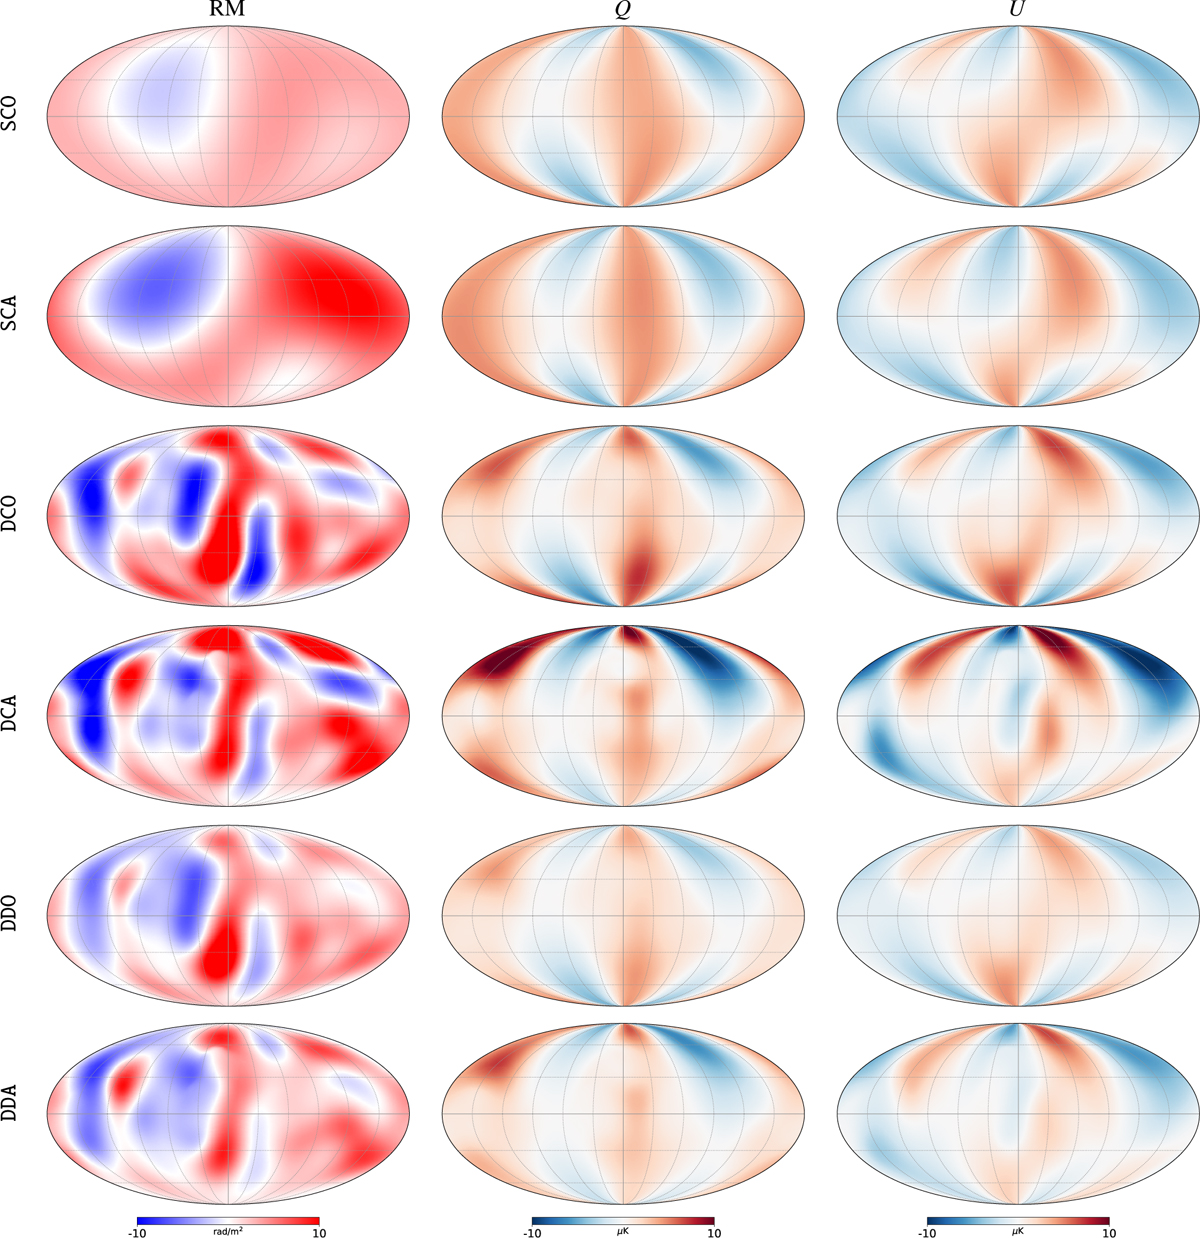
Mollweide projection of the full-sky maps of the contributions from the shell of the Local Bubble to the RM, Q, and U signal (from left to right) as predicted for our different scenarios (rows). Maps are given in Galactic coordinates with the Galactic center at the center of the maps, Galactic longitude increases to the left and the Galactic north pole is at the top. Color scales are shared in columns. They range from -10 to 10 rad/m2 for the RM maps and from –10 to 10 µK for Q and U maps.
Current usage metrics show cumulative count of Article Views (full-text article views including HTML views, PDF and ePub downloads, according to the available data) and Abstracts Views on Vision4Press platform.
Data correspond to usage on the plateform after 2015. The current usage metrics is available 48-96 hours after online publication and is updated daily on week days.
Initial download of the metrics may take a while.