Fig. 5
Download original image
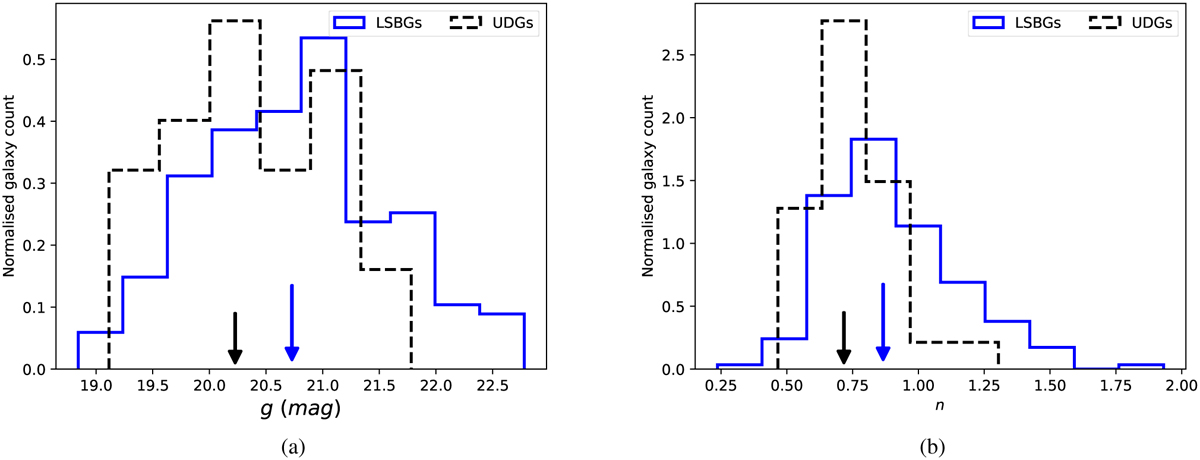
Normalised distributions of the g-band magnitude and Sérsic index for the LSBGs and UDGs identified from HSC data in this study are shown in the left (a) and right (b) panels, respectively. The long black arrow shows the median of the UDG distribution, and the shorter blue arrow shows the median of the LSBG distribution in both plots.
Current usage metrics show cumulative count of Article Views (full-text article views including HTML views, PDF and ePub downloads, according to the available data) and Abstracts Views on Vision4Press platform.
Data correspond to usage on the plateform after 2015. The current usage metrics is available 48-96 hours after online publication and is updated daily on week days.
Initial download of the metrics may take a while.