Open Access
Fig. 4
Download original image
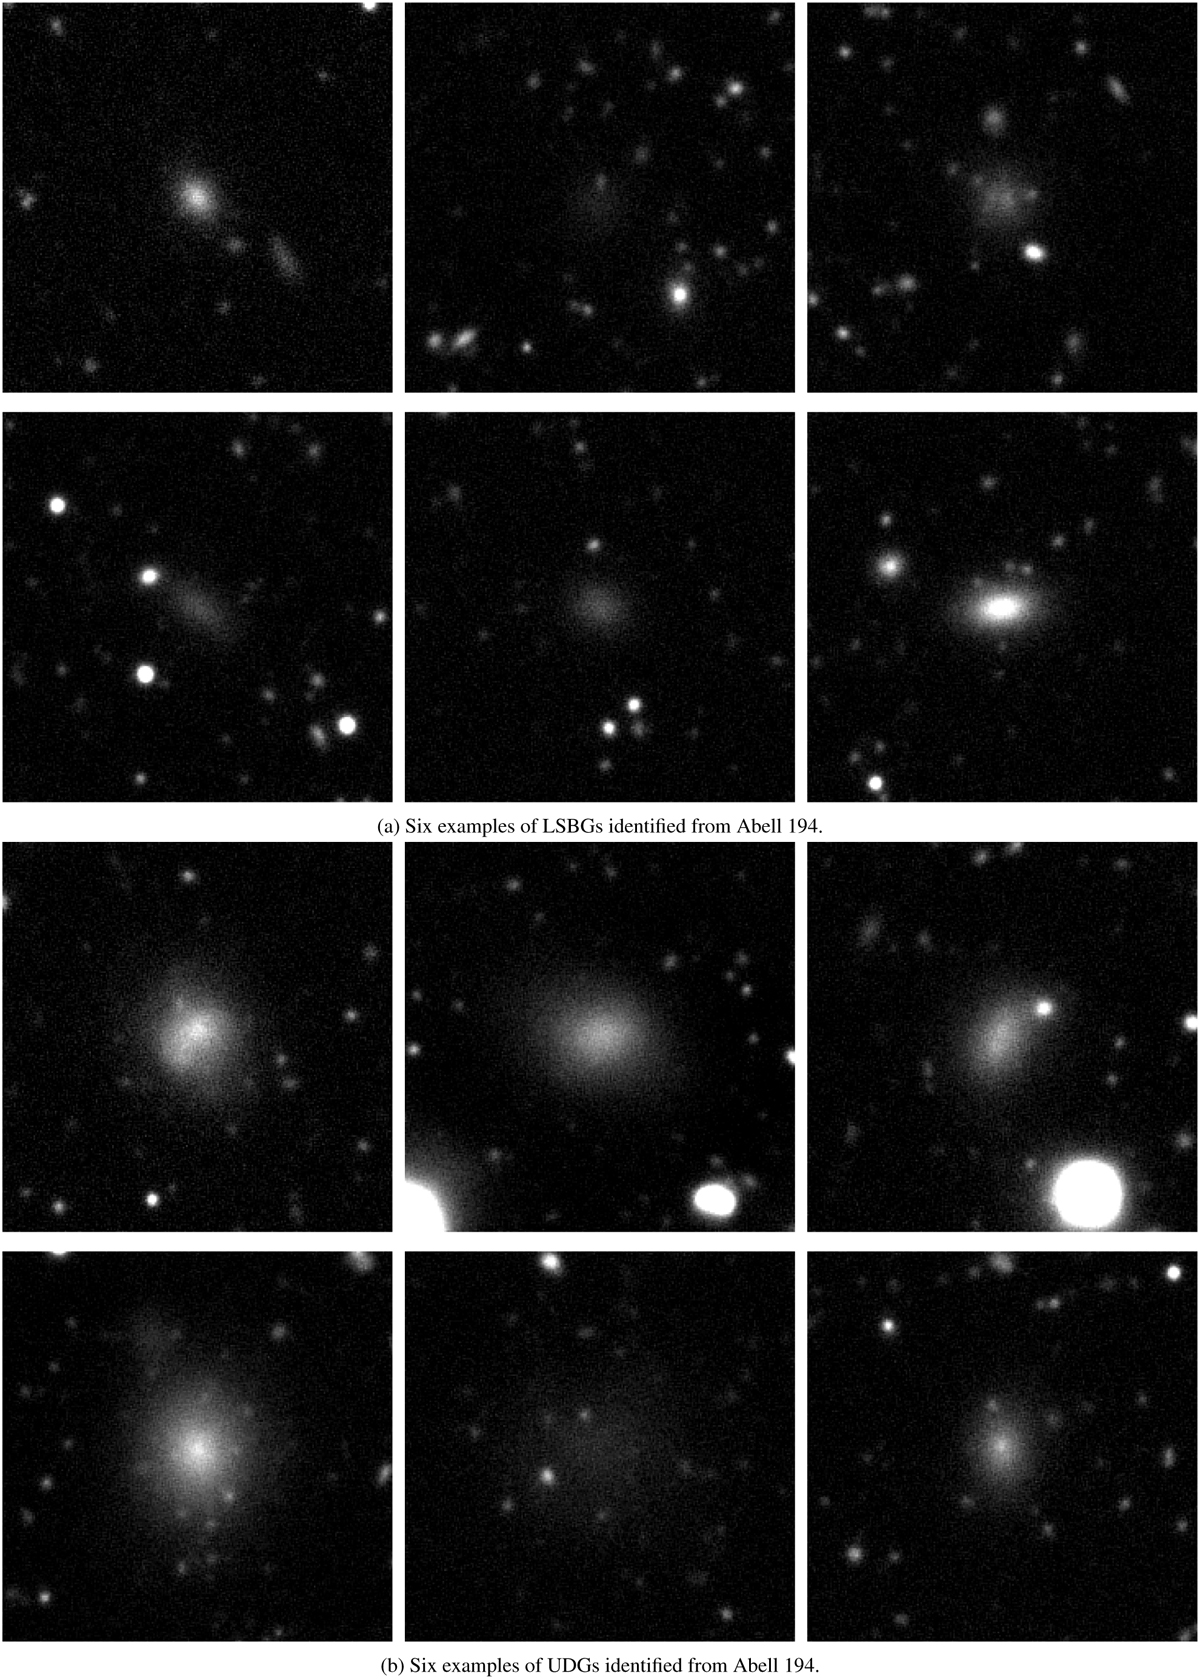
Top panel (a): shows six examples of LSBGs identified from our study. Bottom panel (b): shows six examples of UDGs identified from our study. Each cut-out of the LSBG and UDG corresponds to a 40″ × 40″ (152 × 152 pixels) region of the sky centred around the LSBG or the UDG in the g-band.
Current usage metrics show cumulative count of Article Views (full-text article views including HTML views, PDF and ePub downloads, according to the available data) and Abstracts Views on Vision4Press platform.
Data correspond to usage on the plateform after 2015. The current usage metrics is available 48-96 hours after online publication and is updated daily on week days.
Initial download of the metrics may take a while.