Fig. 1
Download original image
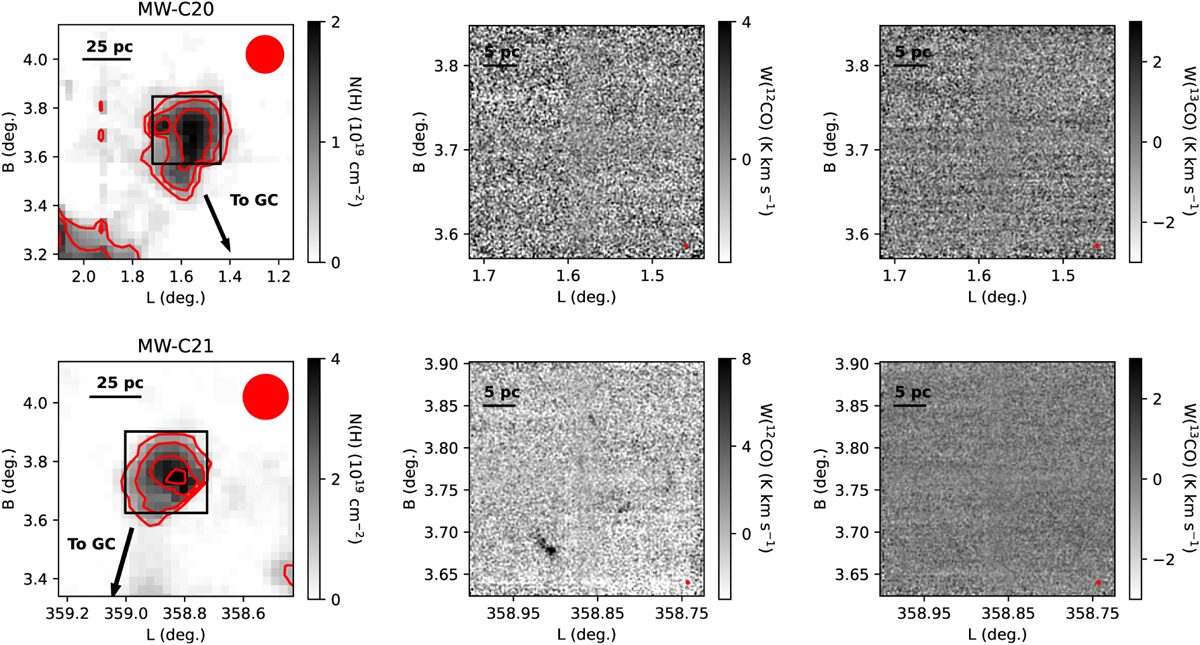
Images of atomic hydrogen column density, 12CO and 13CO integrated intensities for (top row) MW-C20 and (bottom row) MW-C21. The N(H I) contour levels are (0.5, 1, 1.5)×1019 cm−2 and (1, 2, 3, 4)×1019 cm−2, respectively. While 12CO emission is visible in several regions of MW-C21, the broad velocity range with respect to the narrow velocity components dilutes the signal with excess noise. No 13CO J=1−0 emission is detected in either cloud. The red circles show the GBT half power beam width of the HI observations. The red circles in the lower right corner of the middle and right images denote the half power beam widths at 12CO and 13CO.
Current usage metrics show cumulative count of Article Views (full-text article views including HTML views, PDF and ePub downloads, according to the available data) and Abstracts Views on Vision4Press platform.
Data correspond to usage on the plateform after 2015. The current usage metrics is available 48-96 hours after online publication and is updated daily on week days.
Initial download of the metrics may take a while.