Open Access
Fig. A.2.
Download original image
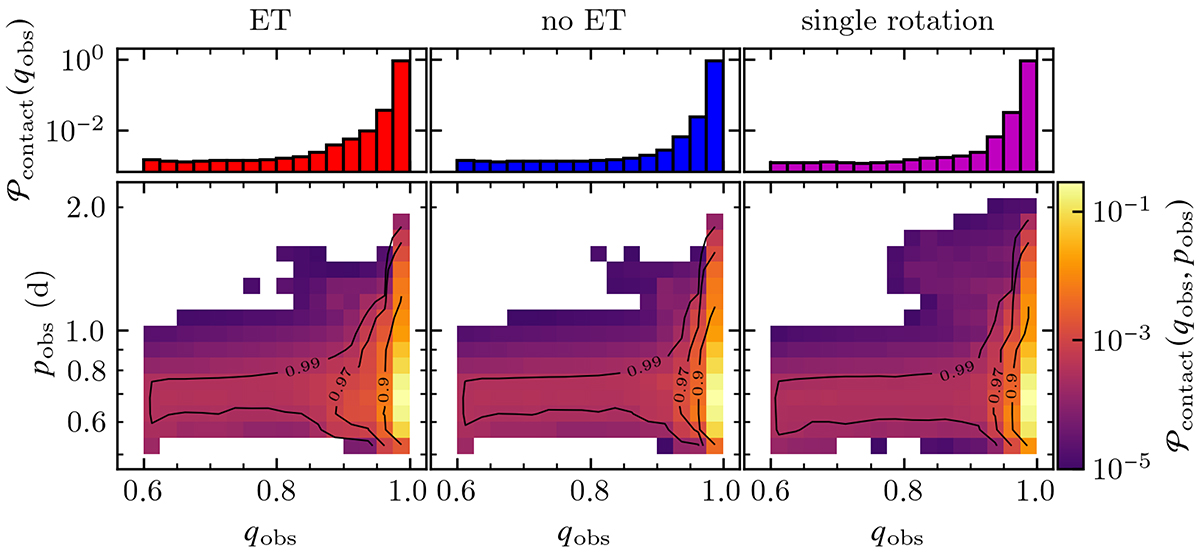
Probability density in (qobs, pobs) (lower panels) and qobs space (upper panels) for the models that experience RLOF at the ZAMS. The thin black lines are highest density intervals of the indicated percentiles, i.e., we expect to observe at most 3% of systems with a mass ratio significantly away from unity.
Current usage metrics show cumulative count of Article Views (full-text article views including HTML views, PDF and ePub downloads, according to the available data) and Abstracts Views on Vision4Press platform.
Data correspond to usage on the plateform after 2015. The current usage metrics is available 48-96 hours after online publication and is updated daily on week days.
Initial download of the metrics may take a while.