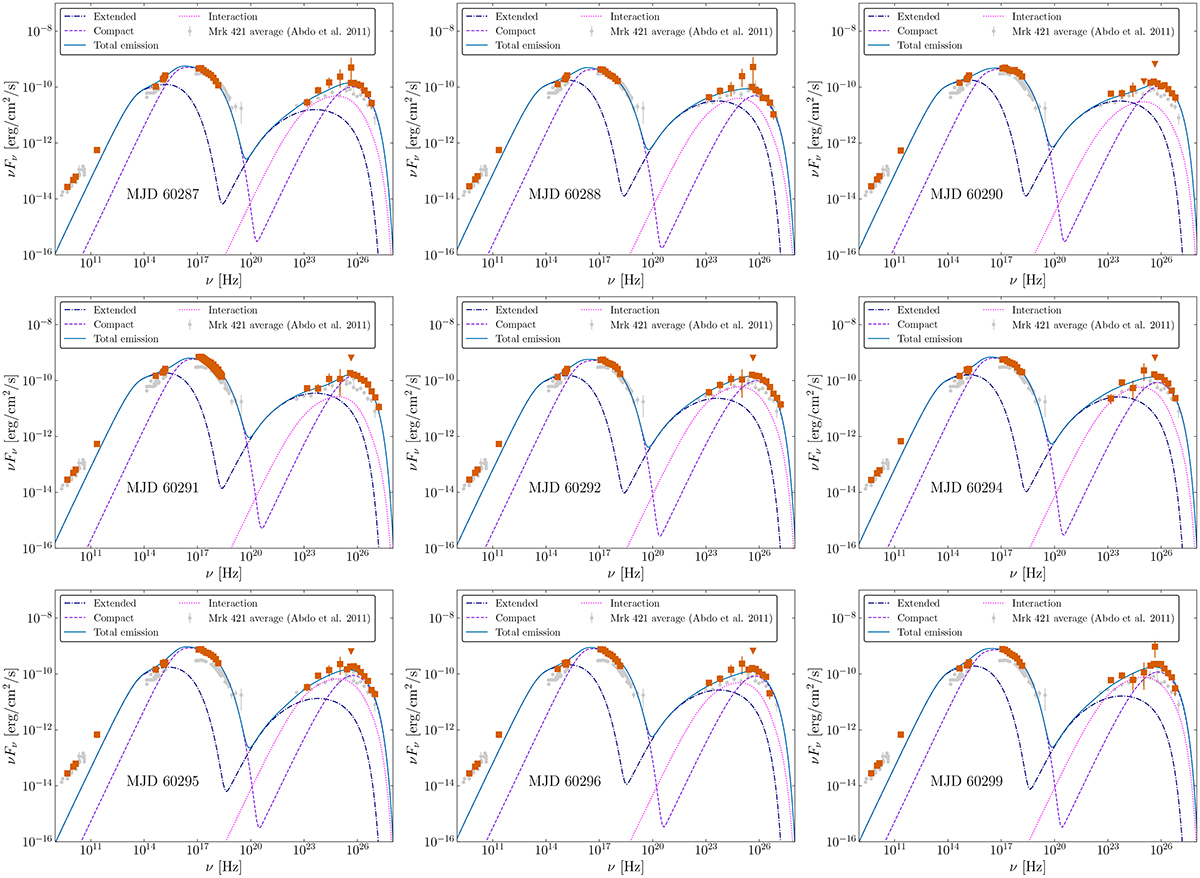
Fig. 8.
Download original image
Theoretical models for of the broadband SEDs during the IXPE observing window, from MJD 60287 to MJD 60299 (December 9, 2023, to December 21, 2023). The observations, spanning from the radio to VHE, are shown by the orange markers. The dashed violet curve is the emission originating from the compact zone, located near the shock front. The dot-dashed blue line is the contribution from the extended zone, which spans a larger volume downstream the shock. The emission produced by the interaction between the two zones is plotted as a pink dotted curve. The solid blue line shows the sum of all the components. For comparison purposes, we plot with gray markers the average state of Mrk 421 (taken from Abdo et al. 2011). The values for the model parameters can be found in Tables 2 and 1 (see Sect. 5 for more details on the modeling procedure).
Current usage metrics show cumulative count of Article Views (full-text article views including HTML views, PDF and ePub downloads, according to the available data) and Abstracts Views on Vision4Press platform.
Data correspond to usage on the plateform after 2015. The current usage metrics is available 48-96 hours after online publication and is updated daily on week days.
Initial download of the metrics may take a while.