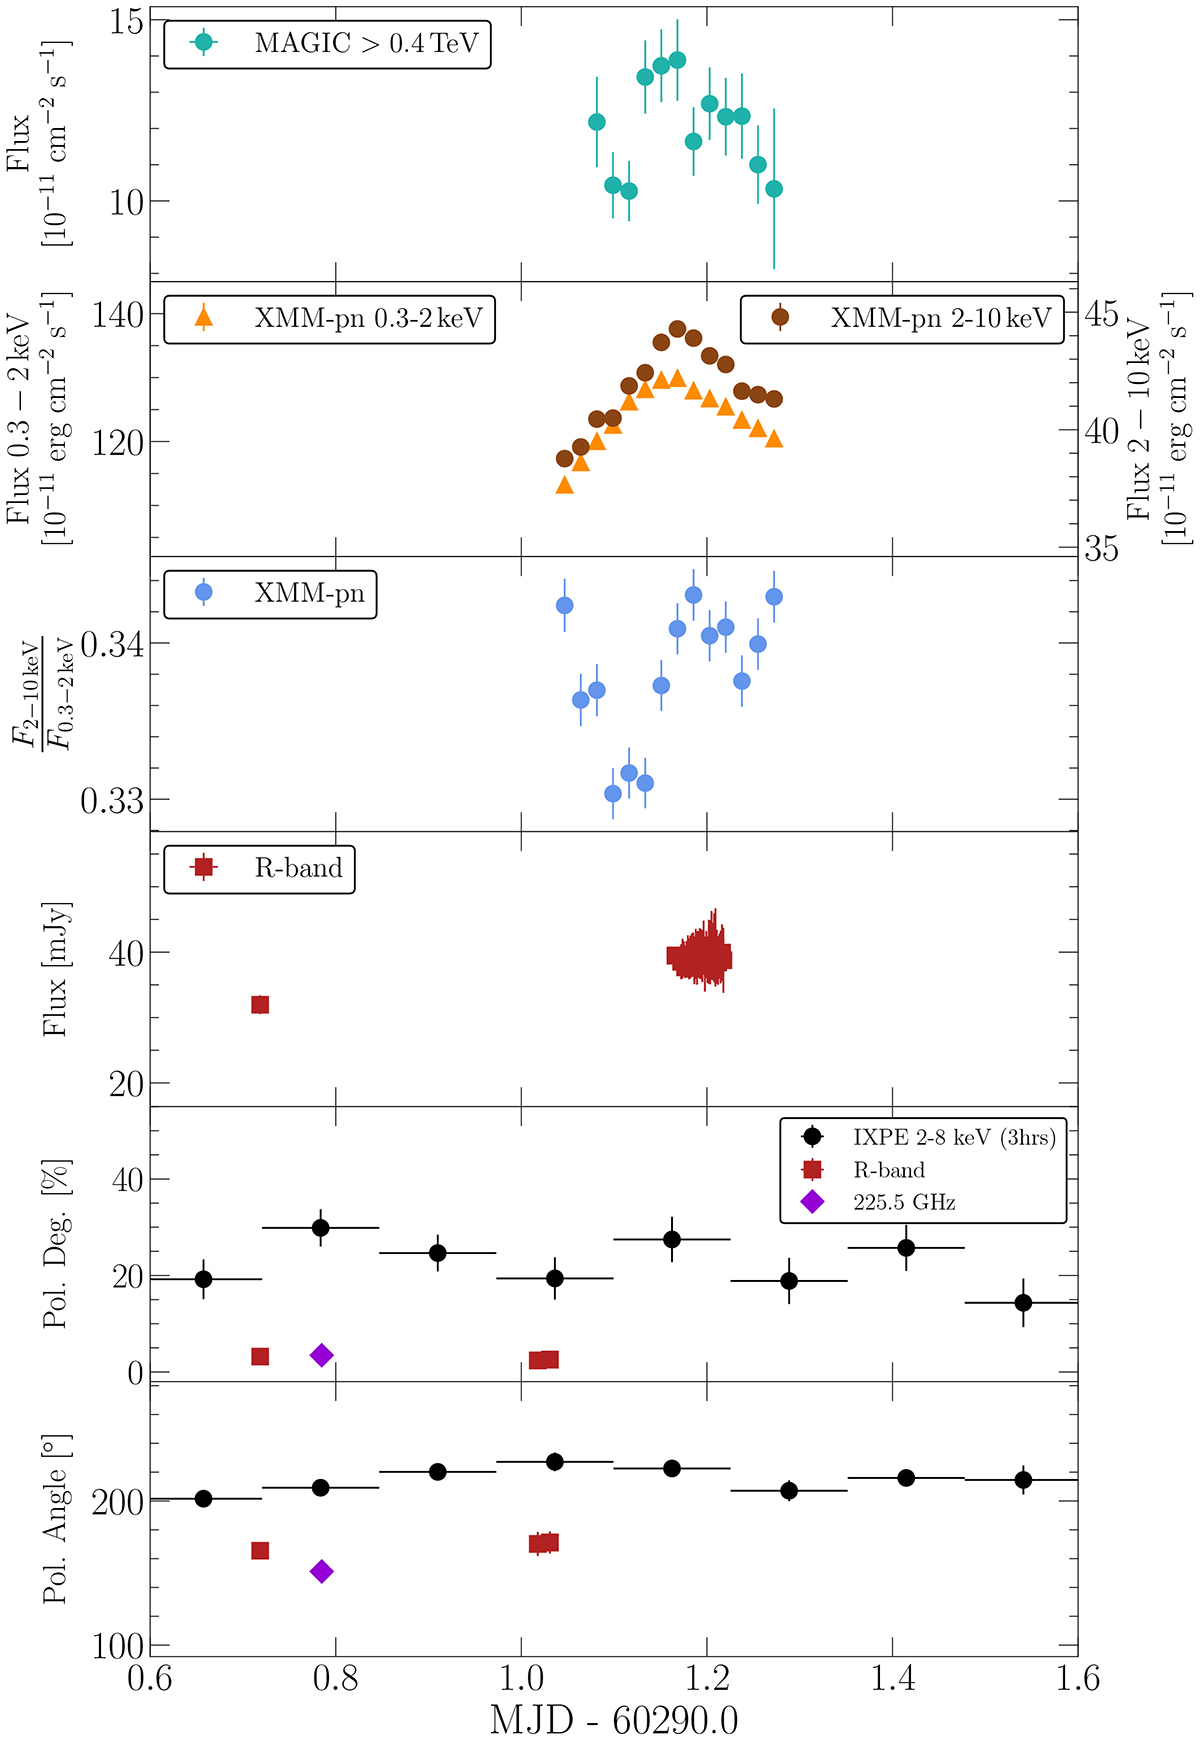
Fig. 5.
Download original image
Multi-wavelength light curves during the multi-hour exposure from MAGIC and XMM-Newton on MJD 60291 (December 13, 2023). The MAGIC fluxes are calculated above 400 GeV and binned over 25-minute intervals. The XMM-Newton fluxes are computed in the same 25-minute bins as MAGIC, and in the 0.3–2 keV and 2–10 keV bands. In the third panel from the top we show the hardness ratio (F2 − 10 keV/F0.3 − 2 keV) from the XMM-Newton data. The bottom panels show the optical (R-band) fluxes, and the polarization in the radio and optical (R-band) with the same binning as in Fig. 1. The black markers represent the X-ray polarization from IXPE binned over 3 h intervals.
Current usage metrics show cumulative count of Article Views (full-text article views including HTML views, PDF and ePub downloads, according to the available data) and Abstracts Views on Vision4Press platform.
Data correspond to usage on the plateform after 2015. The current usage metrics is available 48-96 hours after online publication and is updated daily on week days.
Initial download of the metrics may take a while.