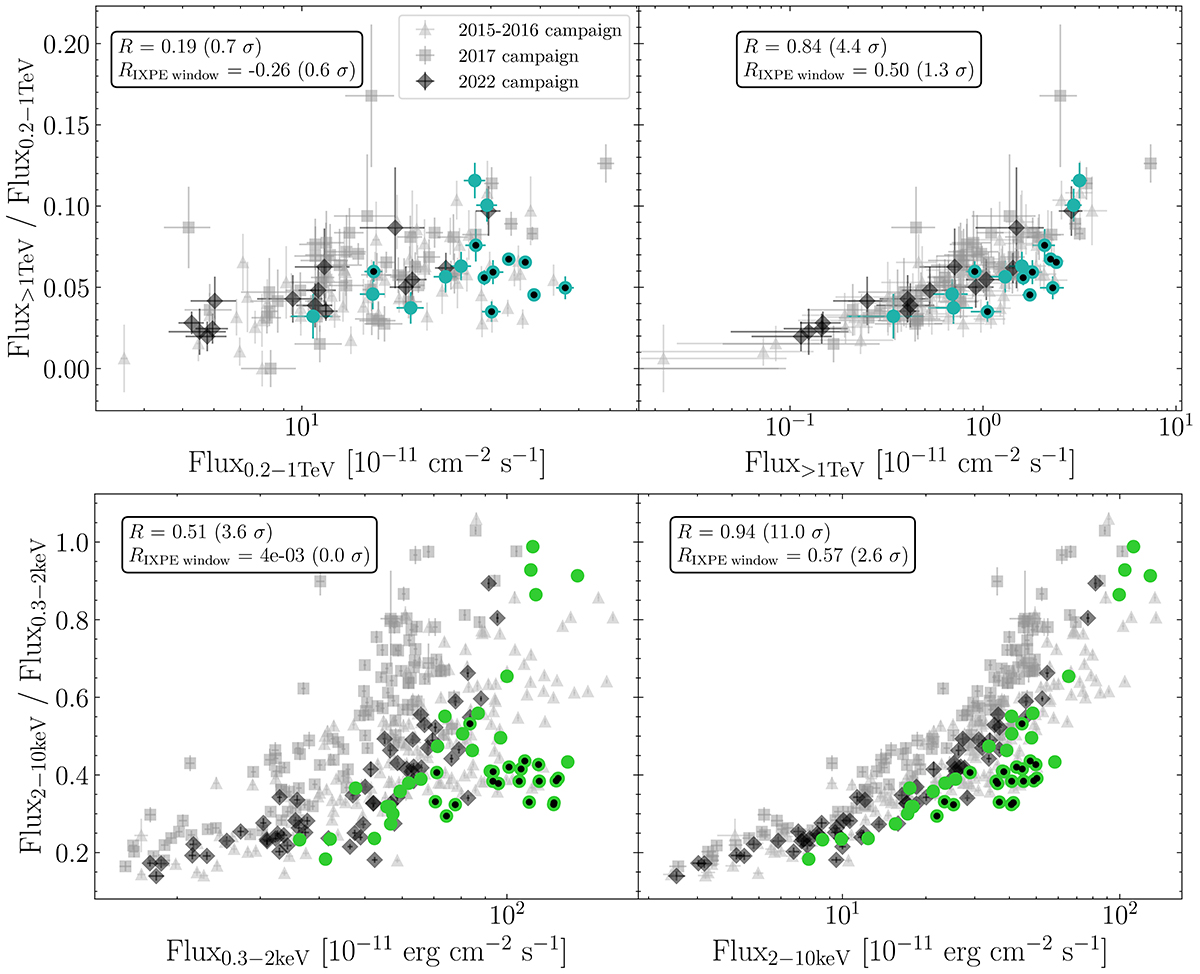
Fig. 4.
Download original image
Hardness ratio in the VHE (upper panels) and X-rays (lower panels) bands. The VHE hardness ratio is defined as the ratio of the > 1 TeV to the 0.2–1 TeV fluxes, while in the X-ray it is the ratio of the 2–10 keV to the 0.3–2 keV fluxes. They are plotted vs the 0.2–1 TeV and > 1 TeV bands, while in the X-ray they are plotted vs the 0.3–2 keV and 2–10 keV bands. The colored circular markers correspond to measurements from the campaign under study, and highlight the data simultaneous with the IXPE window with black-filled markers. Archival measurements from the extensive multi-instrument observing campaigns in the years 2015–2016 (Acciari et al. 2021), 2017 (MAGIC Collaboration 2021), and 2022 (Abe et al. 2024) are plotted as gray triangles, gray squares, and black diamonds, respectively.
Current usage metrics show cumulative count of Article Views (full-text article views including HTML views, PDF and ePub downloads, according to the available data) and Abstracts Views on Vision4Press platform.
Data correspond to usage on the plateform after 2015. The current usage metrics is available 48-96 hours after online publication and is updated daily on week days.
Initial download of the metrics may take a while.