Fig. 3
Download original image
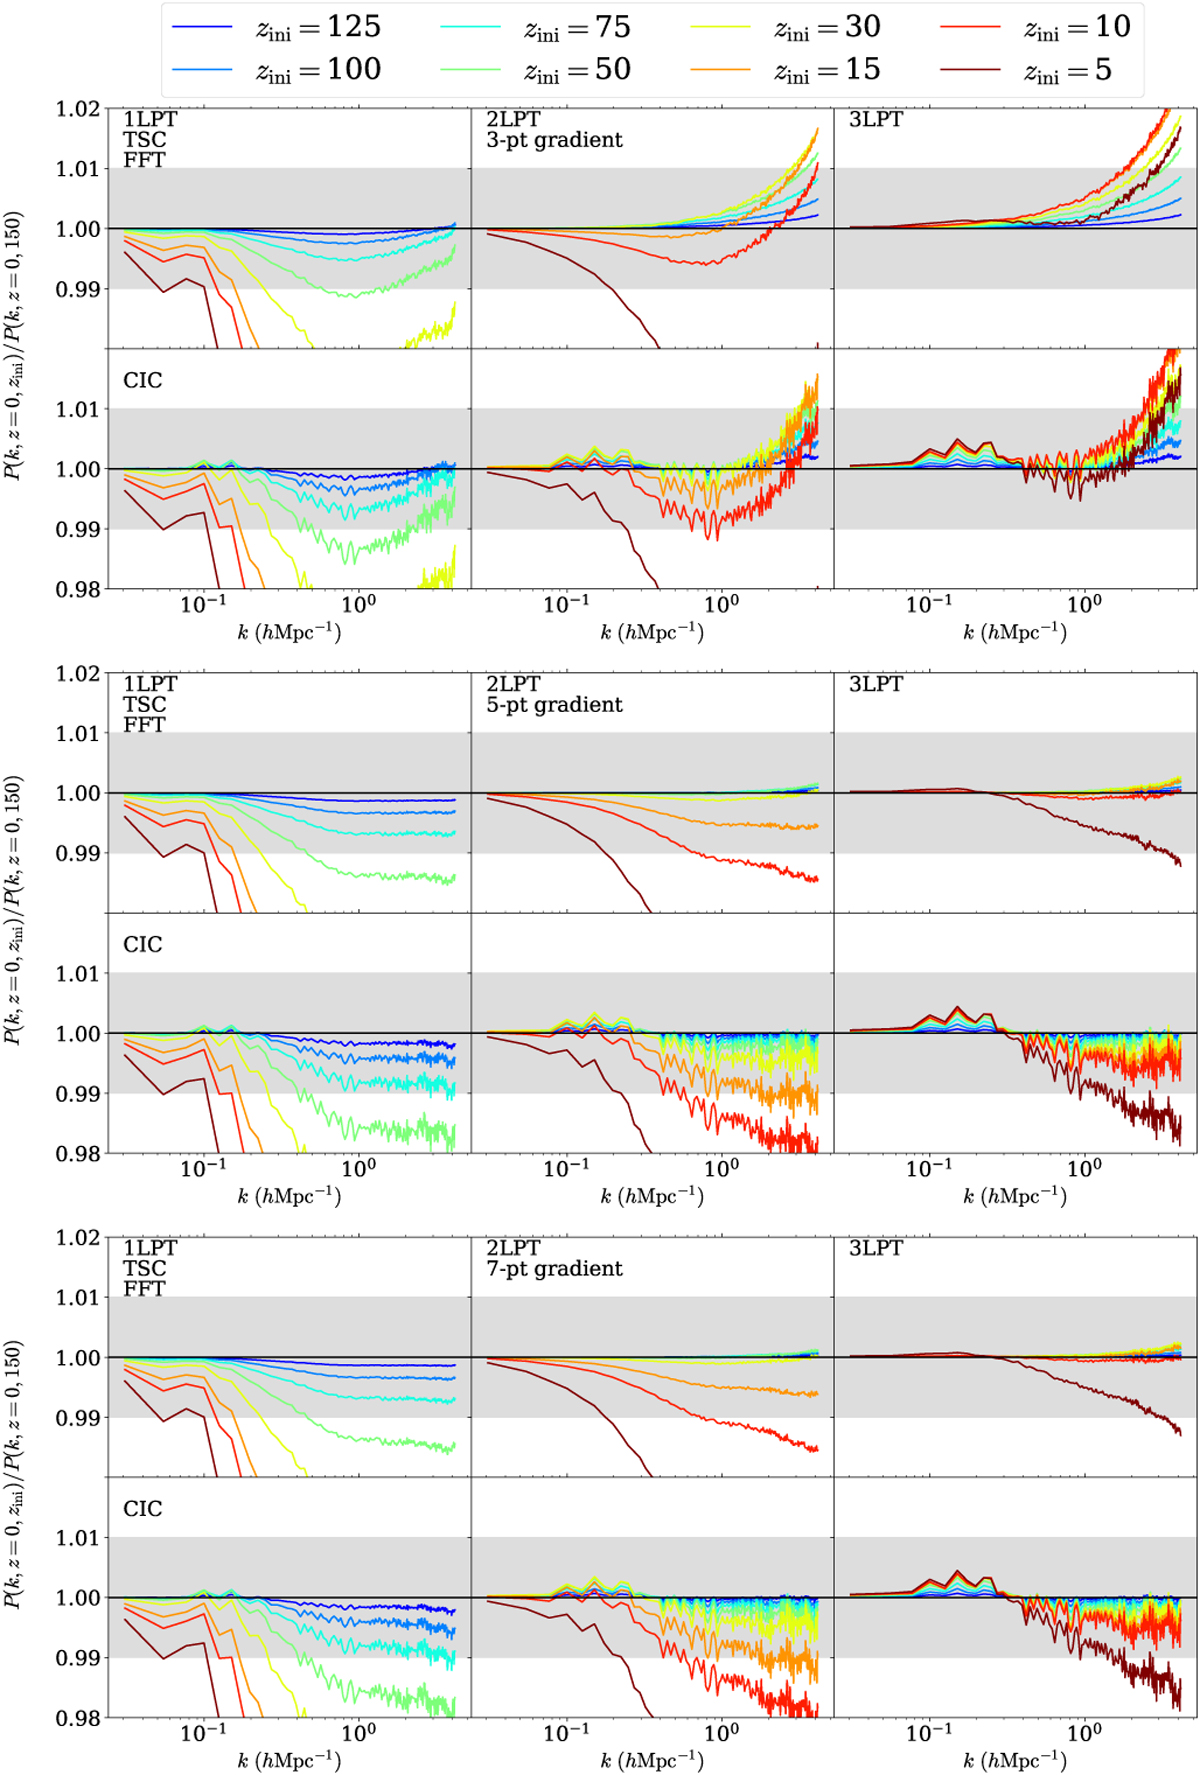
Ratio of the matter power spectrum at z = 0 for different starting redshift zini (in coloured lines), with respect to a reference simulation with zini = 150. We use 1LPT, 2LPT or 3LPT initial conditions from left to right and three-, five- and seven-point gradients from top to bottom panels. We use the FFT solver in any case (see Section 3.8). In each subplot the top and bottom panels show simulations which use TSC and CIC mass-assignments schemes respectively. Grey shaded area denotes a 1% discrepancy w.r.t. the reference power spectrum.
Current usage metrics show cumulative count of Article Views (full-text article views including HTML views, PDF and ePub downloads, according to the available data) and Abstracts Views on Vision4Press platform.
Data correspond to usage on the plateform after 2015. The current usage metrics is available 48-96 hours after online publication and is updated daily on week days.
Initial download of the metrics may take a while.