Fig. D.1
Download original image
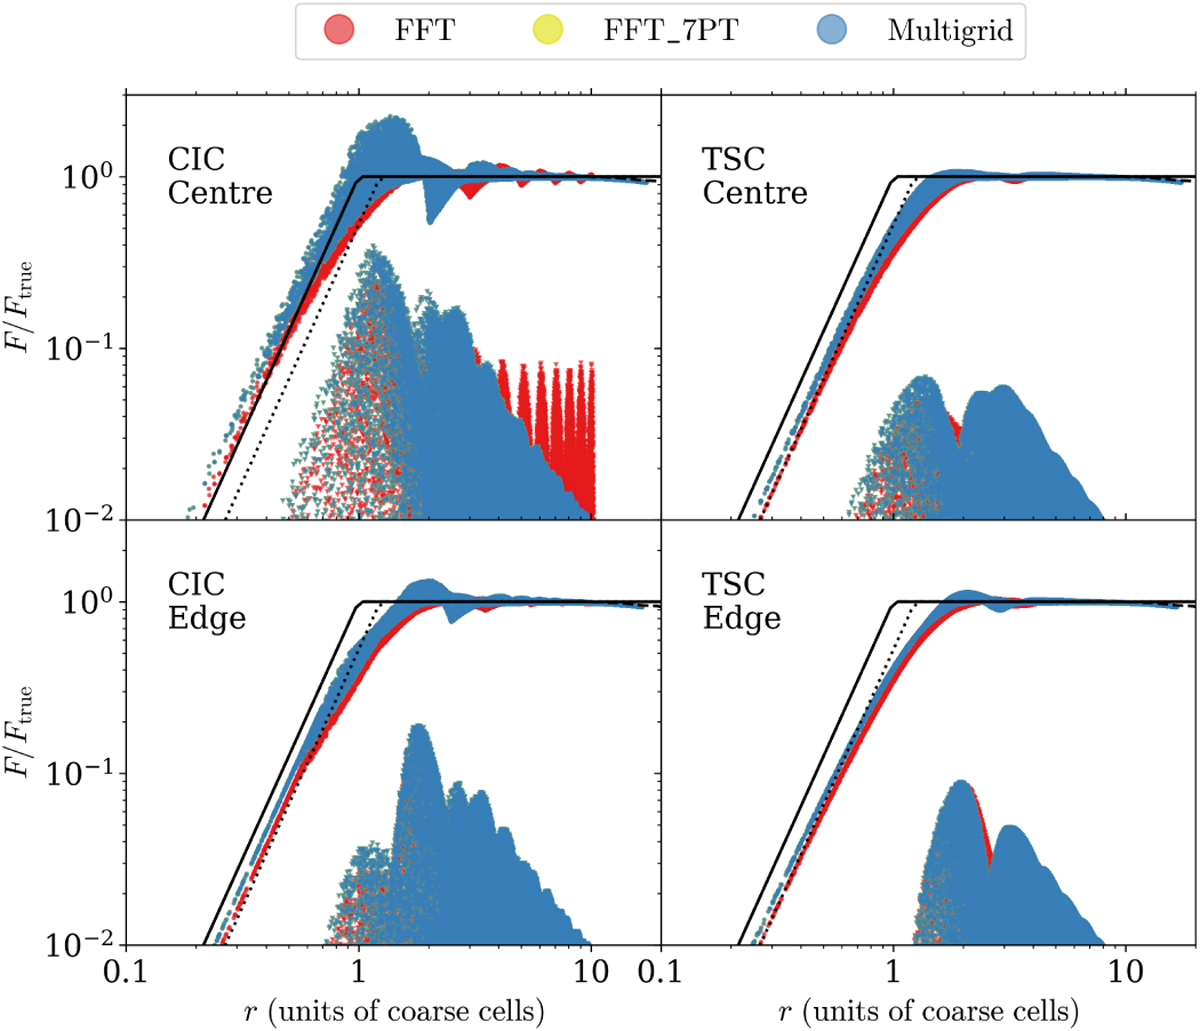
Acceleration of massless particles randomly sampled around a point mass, as a function of distance. The left and right panels illustrate results using the CIC and TSC mass interpolation (and inverse interpolation) schemes, respectively. The top panels show cases where the point mass is positioned at the centre of a cell, while the bottom panels depict cases where it is placed at the edge of a cell. The red, yellow, and blue data points represent accelerations computed using the FFT solver (uncorrected for the mass-assignment scheme), the FFT_7pt solver, and the multigrid solver, respectively. Circles denote radial acceleration, while triangles indicate tangential acceleration. The black solid line represents the theoretical prediction F(r, h) from Eq. (D.1). For comparison, dotted lines correspond to F(r, rs), where rs = (6/π)1/3 h is the radius of a sphere with the same volume as a cell of size 2h. Dashed lines illustrate the periodic case ![]() .
.
Current usage metrics show cumulative count of Article Views (full-text article views including HTML views, PDF and ePub downloads, according to the available data) and Abstracts Views on Vision4Press platform.
Data correspond to usage on the plateform after 2015. The current usage metrics is available 48-96 hours after online publication and is updated daily on week days.
Initial download of the metrics may take a while.