Fig. 6.
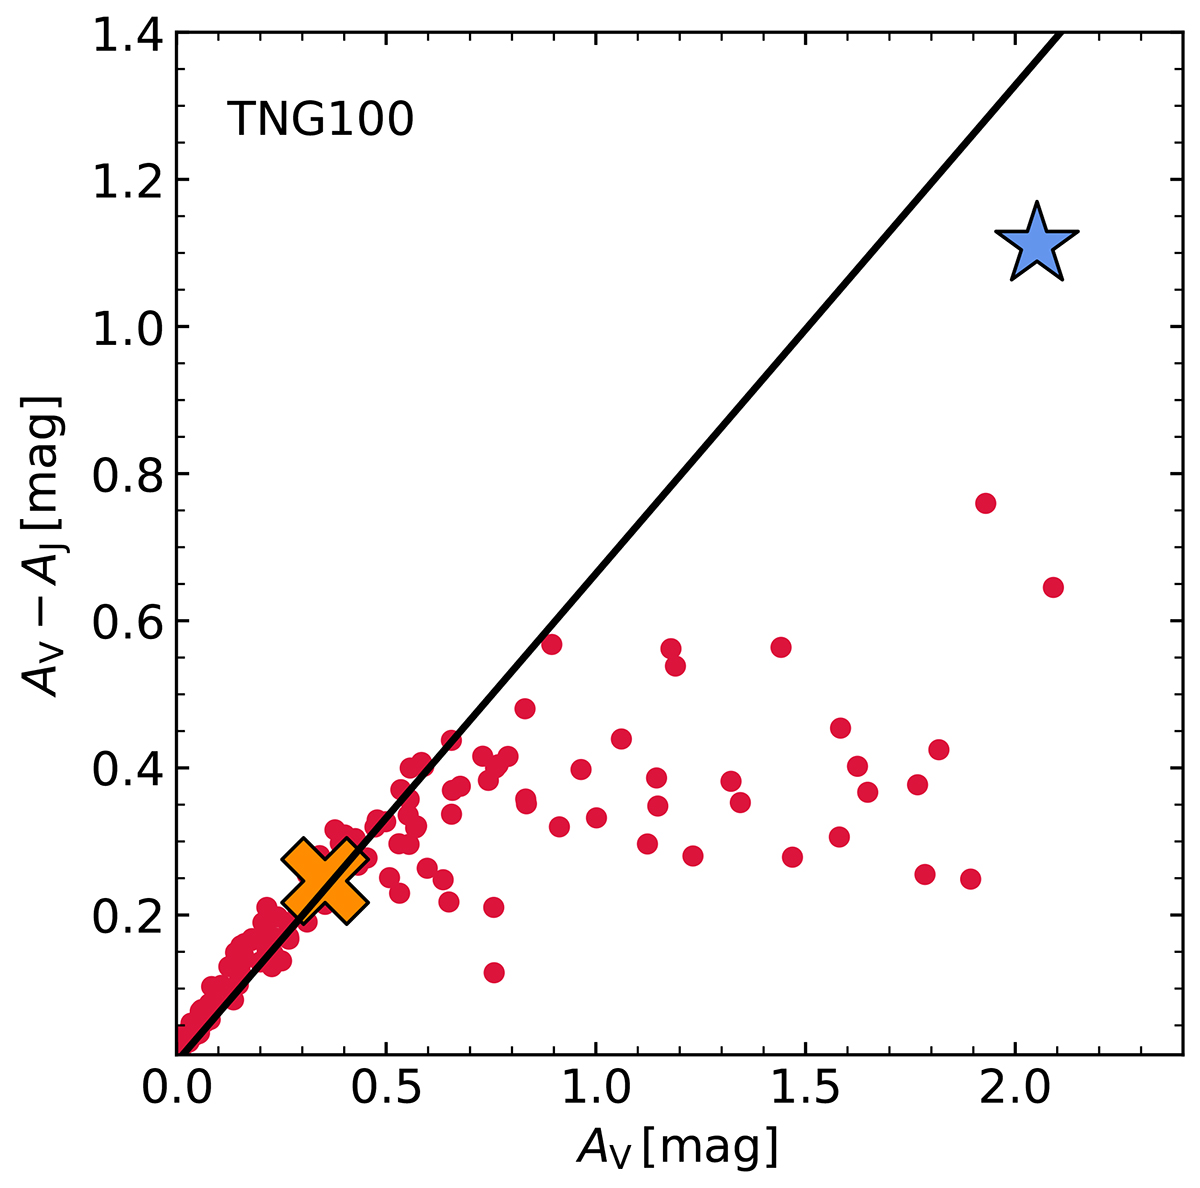
Download original image
Relationship between galaxy V-band attenuation (AV) and V − J reddening (AV − AJ). The straight line shows the expected relation for a thin dust screen with a THEMIS-like extinction curve. The red circles correspond to the attenuation and reddening values in our fiducial dust model for massive, star-forming TNG100 galaxies. The blue star marker indicates the median attenuation and reddening values that the dust-free TNG100 galaxy population would need in order to reproduce the JWST/NIRCam data, while the orange cross marker indicates the actual median values of the TNG100 galaxies. To match the observational data, the attenuation-reddening relation must be almost as steep as in the dust screen model, which is not the case for the TNG100 galaxies postprocessed with dust radiative transfer.
Current usage metrics show cumulative count of Article Views (full-text article views including HTML views, PDF and ePub downloads, according to the available data) and Abstracts Views on Vision4Press platform.
Data correspond to usage on the plateform after 2015. The current usage metrics is available 48-96 hours after online publication and is updated daily on week days.
Initial download of the metrics may take a while.