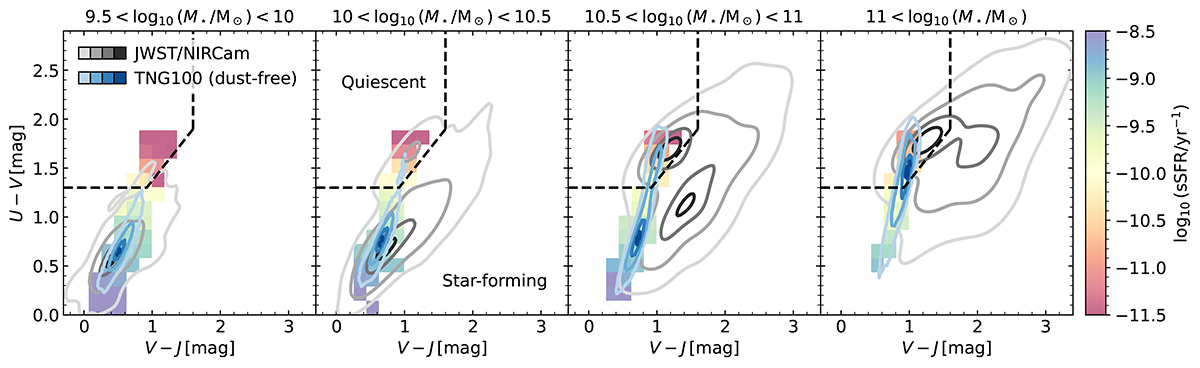
Fig. 2.
Download original image
UVJ diagram in bins of stellar mass, for dust-free TNG100 fluxes (blue contours) and observational JWST/NIRCam data (with 1.8 ≤ z ≤ 2.2, grey contours), which are dust-attenuated. The dashed line indicates the demarcation between quiescent and star-forming galaxies from Williams et al. (2009) in their highest redshift bin (1 ≤ z ≤ 2). Here, and in all other figures, the contours are estimated from a two-dimensional (2D) kernel density estimate and enclose the densest 5, 25, 70, and 95 percent of the data. The TNG100 distributions are color-coded by their mean logarithmic specific star-formation rates in bins of V − J and U − V color. A strong correlation of sSFR with the dust-free UVJ colors of the simulated galaxies is evident. Dust attenuation must shift the simulated massive star-forming galaxies to redder colors in order to reproduce the observational distribution in the UVJ diagram.
Current usage metrics show cumulative count of Article Views (full-text article views including HTML views, PDF and ePub downloads, according to the available data) and Abstracts Views on Vision4Press platform.
Data correspond to usage on the plateform after 2015. The current usage metrics is available 48-96 hours after online publication and is updated daily on week days.
Initial download of the metrics may take a while.