Fig. 12.
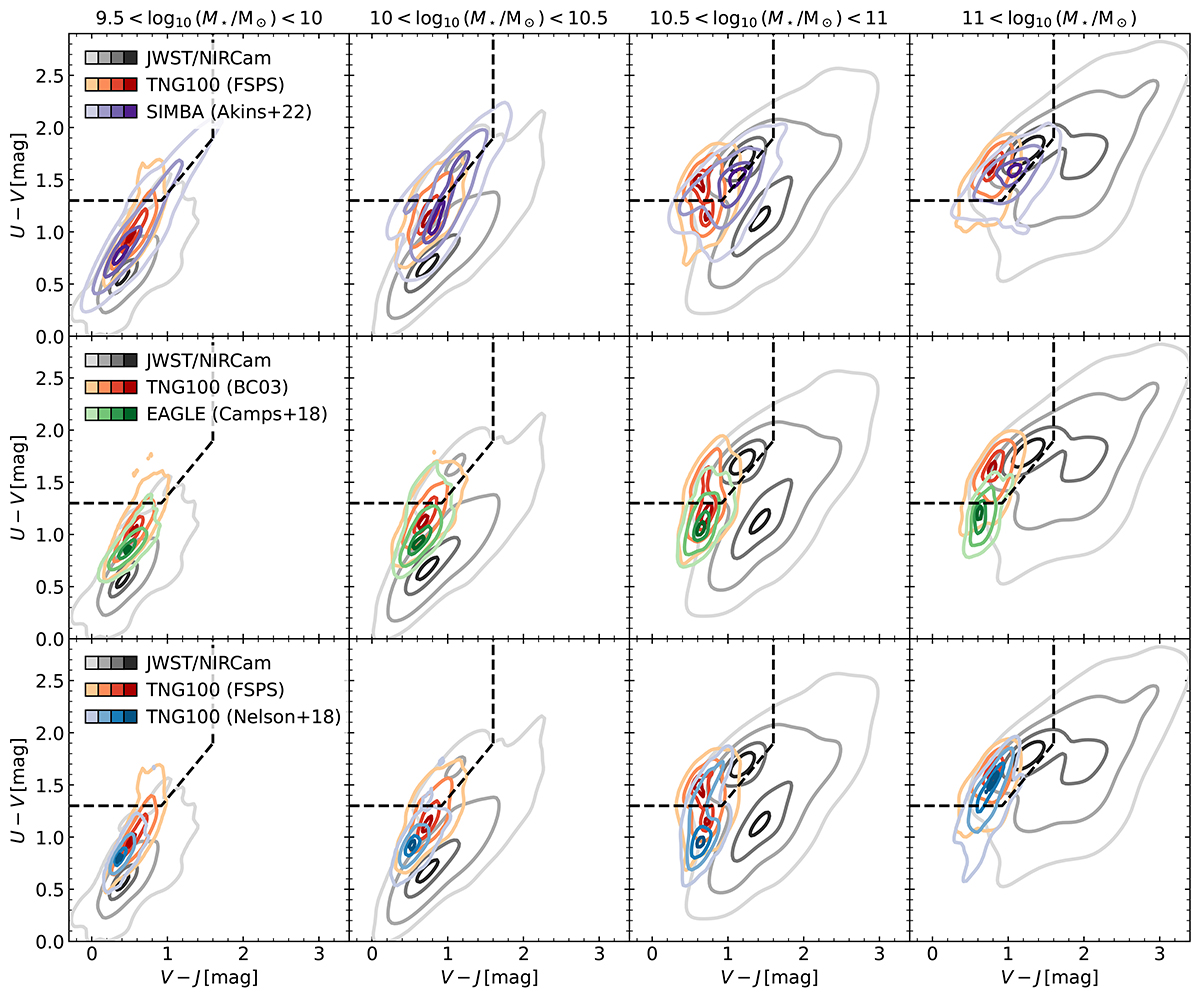
Download original image
Comparison of dust-attenuated TNG100 UVJ colors to various simulation datasets. In all rows, our TNG100 colors (red contours) correspond to our fiducial SKIRT post-processing including dust, but varying the SED templates (either using Bruzual & Charlot 2003 or FSPS-MILES) to be consistent with the simulated colors that we compare to. In the upper panels, we compare to UVJ colors from Akins et al. (2022) from the SIMBA simulation (purple contours). The center panels show the comparison to the UVJ colors from Camps et al. (2018) for the EAGLE simulation (green contours). The lower panels show a comparison to an alternative method to obtain the dust-attenuated UVJ colors for TNG100 based on raytracing (Nelson et al. 2018, blue contours). Differences in the models arise due to the usage of different dust attenuation methods, varying the treatment of young stellar populations, and differences in the cosmological simulation, but we note that all models fail to reproduce the massive dust-reddened galaxies seen with JWST/NIRCam.
Current usage metrics show cumulative count of Article Views (full-text article views including HTML views, PDF and ePub downloads, according to the available data) and Abstracts Views on Vision4Press platform.
Data correspond to usage on the plateform after 2015. The current usage metrics is available 48-96 hours after online publication and is updated daily on week days.
Initial download of the metrics may take a while.