Fig. 10.
Download original image
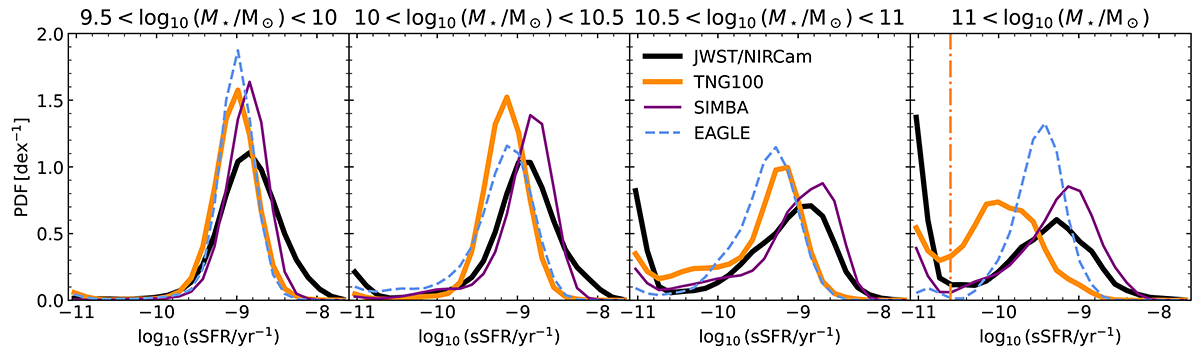
sSFR distribution in different stellar mass bins at redshift two, for various cosmological simulations (TNG100, SIMBA, and EAGLE) and the observational JWST/NIRCam data (derived with EAZY). The vertical orange line in the highest-mass bin marks our threshold to select massive, star-forming galaxies in TNG100. Galaxies with a sSFR below the shown log10(sSFR) grid are assigned to the lowest sSFR bin. The galaxy main sequence in the cosmological simulations diverges at high stellar masses, but they all exhibit a population of massive, star-forming galaxies as seen in the observations.
Current usage metrics show cumulative count of Article Views (full-text article views including HTML views, PDF and ePub downloads, according to the available data) and Abstracts Views on Vision4Press platform.
Data correspond to usage on the plateform after 2015. The current usage metrics is available 48-96 hours after online publication and is updated daily on week days.
Initial download of the metrics may take a while.