Fig. B.1
Download original image
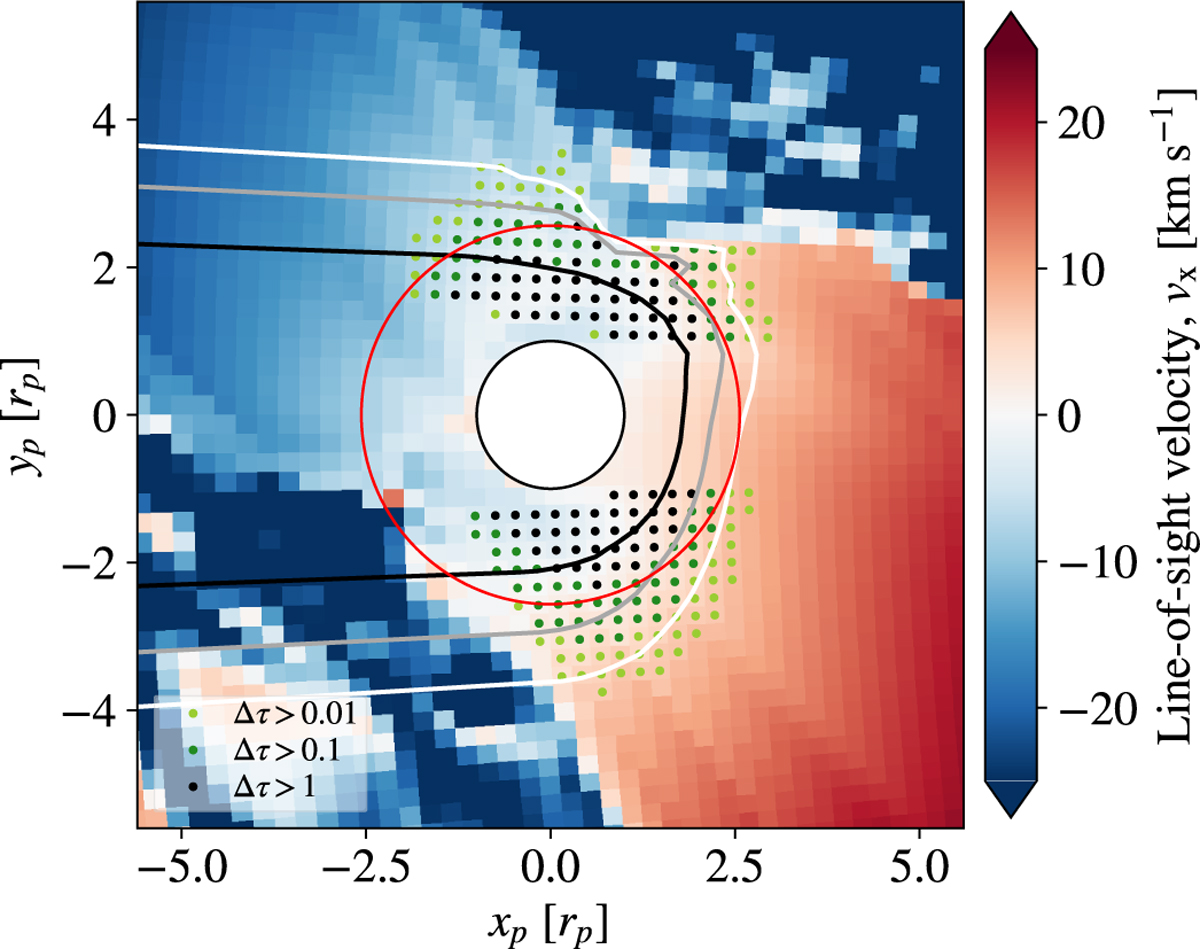
Line-of-sight velocity in the vicinity of the planet in the orbital midplane for simulation model S2*. The observer is positioned along the negative x-axis, with the velocity component in the x direction representing the observer’s perspective during mid-transit. The black and red circles indicate the planetary radius and the Hill radius, respectively. This analysis focuses solely on the main component of the metastable helium line. Black, gray, and white contours mark the cumulative optical depth of τ = 10, 1, and 0.1, respectively, along the radial direction toward the observer. The dots indicate high optical depth values (Δτ) in the simulation grid. This figure highlights the primary region of He I 1083 nm line formation.
Current usage metrics show cumulative count of Article Views (full-text article views including HTML views, PDF and ePub downloads, according to the available data) and Abstracts Views on Vision4Press platform.
Data correspond to usage on the plateform after 2015. The current usage metrics is available 48-96 hours after online publication and is updated daily on week days.
Initial download of the metrics may take a while.