Fig. 6
Download original image
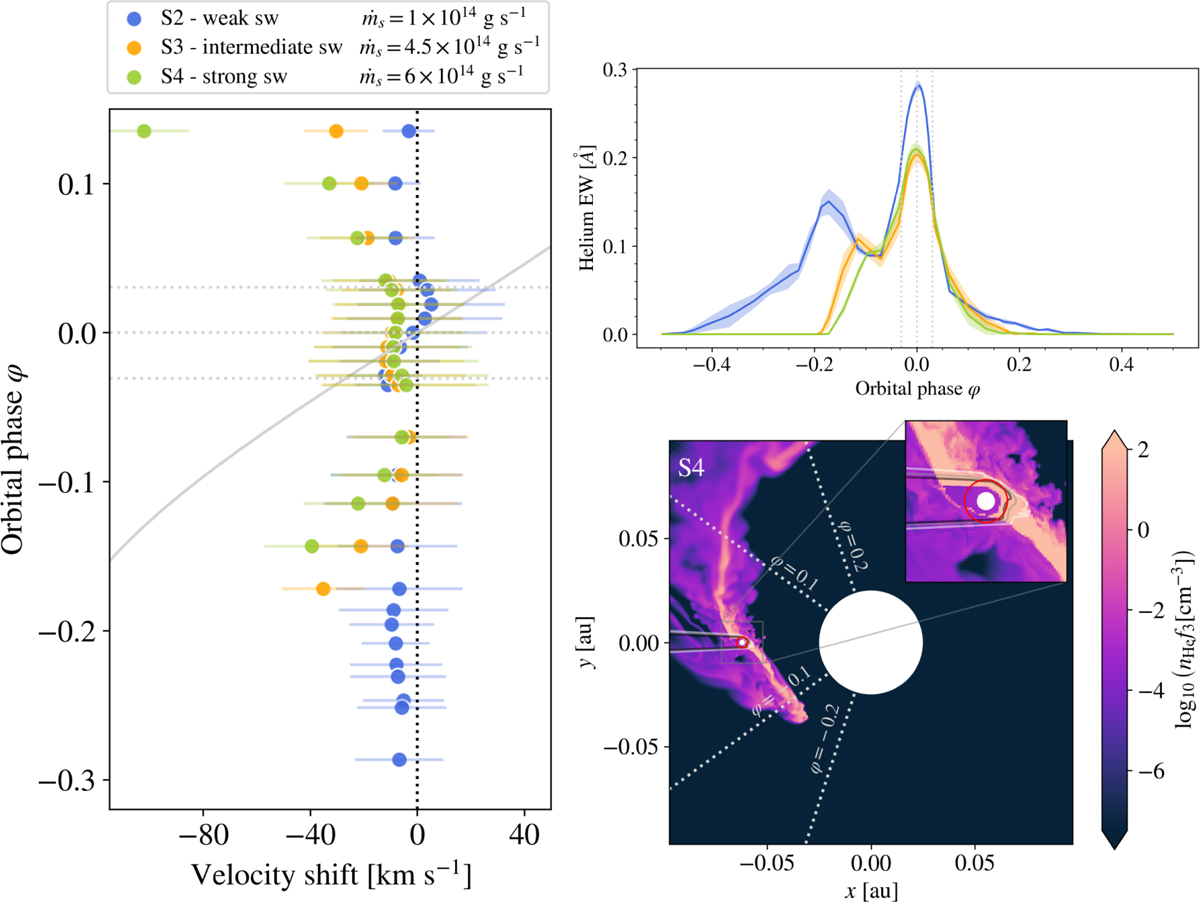
Impact of stellar wind (sw) on planetary outflow and He I 1083 nm line velocity shifts. Left: helium line velocity shift in the stellar rest frame across orbital phases for models S2, S3, and S4. The error bars represent the full width at half maximum, adjusted by dividing by ![]() to approximate the standard deviation of a Gaussian distribution. The vertical gray line indicates the planetary movement. Top right: corresponding light curves. Bottom right: metastable helium number density in the orbital midplane under a strong stellar wind influence (model S4). Black, gray, and white contours mark the cumulative optical depth of τ = 10, 1, and 0.1, respectively, of the metastable helium line toward the observer in the radial direction. The helium blueshift increases with increasing stellar mass-loss rate, providing insights into wind kinematics. A strong stellar wind diminishes the planetary outflow, making the light curve a more robust analysis tool for characterizing the atmospheric escape.
to approximate the standard deviation of a Gaussian distribution. The vertical gray line indicates the planetary movement. Top right: corresponding light curves. Bottom right: metastable helium number density in the orbital midplane under a strong stellar wind influence (model S4). Black, gray, and white contours mark the cumulative optical depth of τ = 10, 1, and 0.1, respectively, of the metastable helium line toward the observer in the radial direction. The helium blueshift increases with increasing stellar mass-loss rate, providing insights into wind kinematics. A strong stellar wind diminishes the planetary outflow, making the light curve a more robust analysis tool for characterizing the atmospheric escape.
Current usage metrics show cumulative count of Article Views (full-text article views including HTML views, PDF and ePub downloads, according to the available data) and Abstracts Views on Vision4Press platform.
Data correspond to usage on the plateform after 2015. The current usage metrics is available 48-96 hours after online publication and is updated daily on week days.
Initial download of the metrics may take a while.