Fig. 4
Download original image
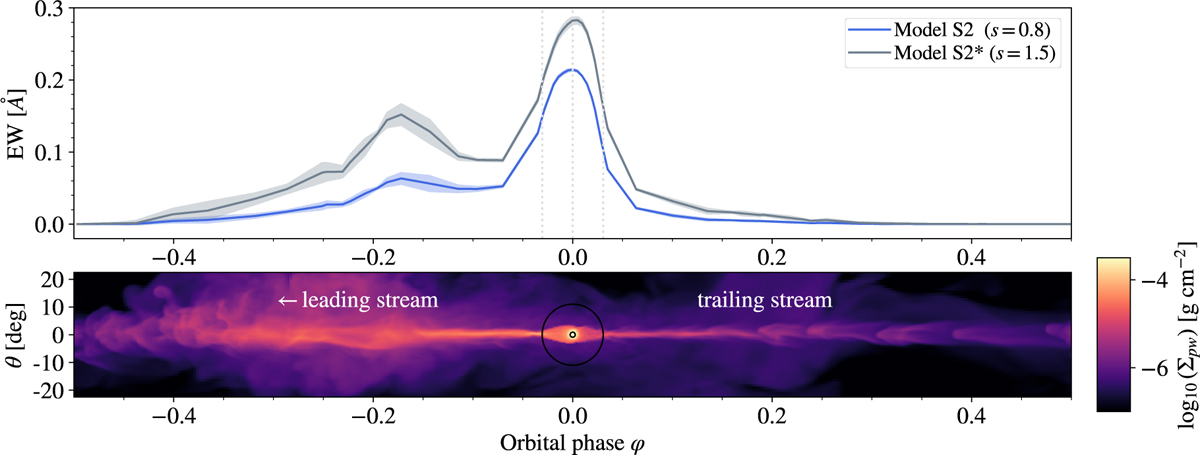
EW of the helium 1083 nm line across orbital phases (top) in comparison to the surface density projected along the radial direction of the planetary wind, ∑pw, along the orbit of model S1 (bottom). In the spectral light curve, we show two different density scalings, s, of the same simulation snapshot: one that matches the in-transit absorption (S2, blue) and one that fits the post-transit absorption (S2*, gray). The black circles indicate the angular sizes of the planet and the star. The local maximum at φ = −0.2 in the light curve can be explained by the large vertical extent of the gas, a result of instabilities induced by the stellar wind.
Current usage metrics show cumulative count of Article Views (full-text article views including HTML views, PDF and ePub downloads, according to the available data) and Abstracts Views on Vision4Press platform.
Data correspond to usage on the plateform after 2015. The current usage metrics is available 48-96 hours after online publication and is updated daily on week days.
Initial download of the metrics may take a while.