Fig. 4
Download original image
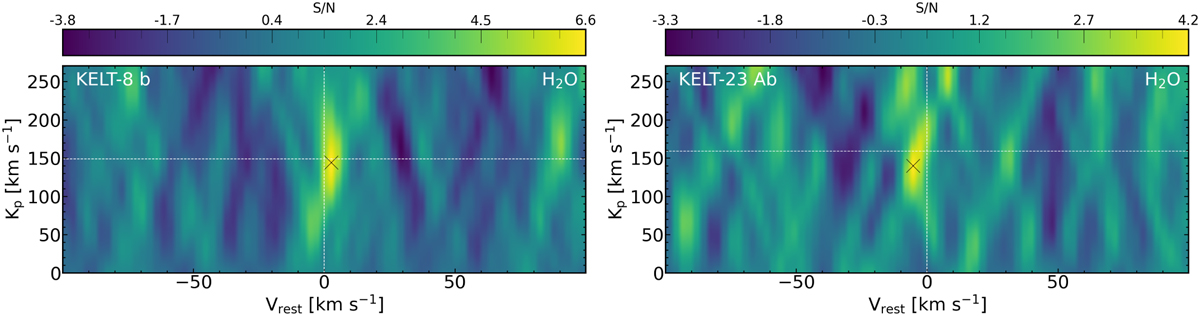
(S/N) Kp – Vrest maps. These maps are built by cross-correlating a single-species model of H2O with data of KELT-8 b (left panel) and KELT-23 Ab (right panel), as described in the text. The maps are computed dividing the CCF values by the standard deviation of the noise far (| Vrest | ≥ 25 km s−1 ) from the peak. The horizontal (vertical) white dashed lines represent the expected Kp ( Vrest) of the atmospheric signal. The black ‘×’ marks denote the cross-correlation maximum in each plot.
Current usage metrics show cumulative count of Article Views (full-text article views including HTML views, PDF and ePub downloads, according to the available data) and Abstracts Views on Vision4Press platform.
Data correspond to usage on the plateform after 2015. The current usage metrics is available 48-96 hours after online publication and is updated daily on week days.
Initial download of the metrics may take a while.