Fig. 2
Download original image
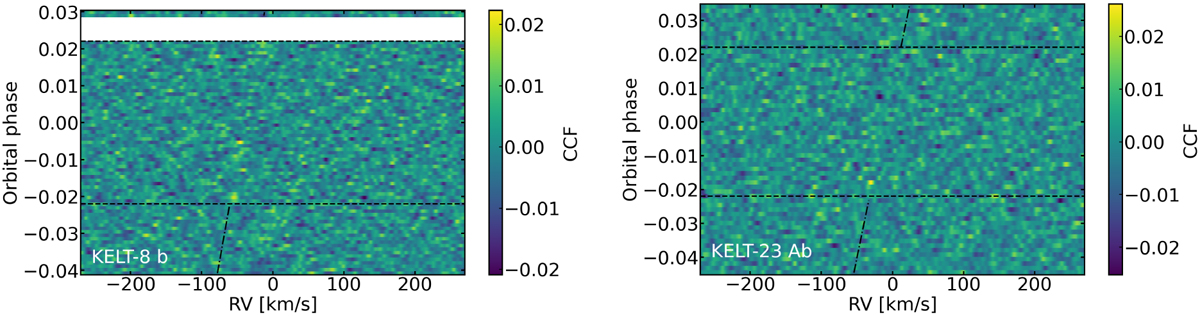
CCF values as a function of the orbital phase computed by cross-correlating the model containing only H2O with the data of 23 June 2020 (left panel) and 15 April 2023 (right panel). The horizontal dashed lines represent the transit ingress and egress while the dash-dotted line represents the expected CCF peak trail due to the planetary motion, as measured in the observer rest frame. The expected CCF peak trail in transit is not represented for clarity. As shown, no telluric residuals are visible by eye at RV = 0 km s−1 in both datasets. The white horizontal band in the left panel corresponds to a lack of out-of-transit spectra.
Current usage metrics show cumulative count of Article Views (full-text article views including HTML views, PDF and ePub downloads, according to the available data) and Abstracts Views on Vision4Press platform.
Data correspond to usage on the plateform after 2015. The current usage metrics is available 48-96 hours after online publication and is updated daily on week days.
Initial download of the metrics may take a while.