Fig. 1
Download original image
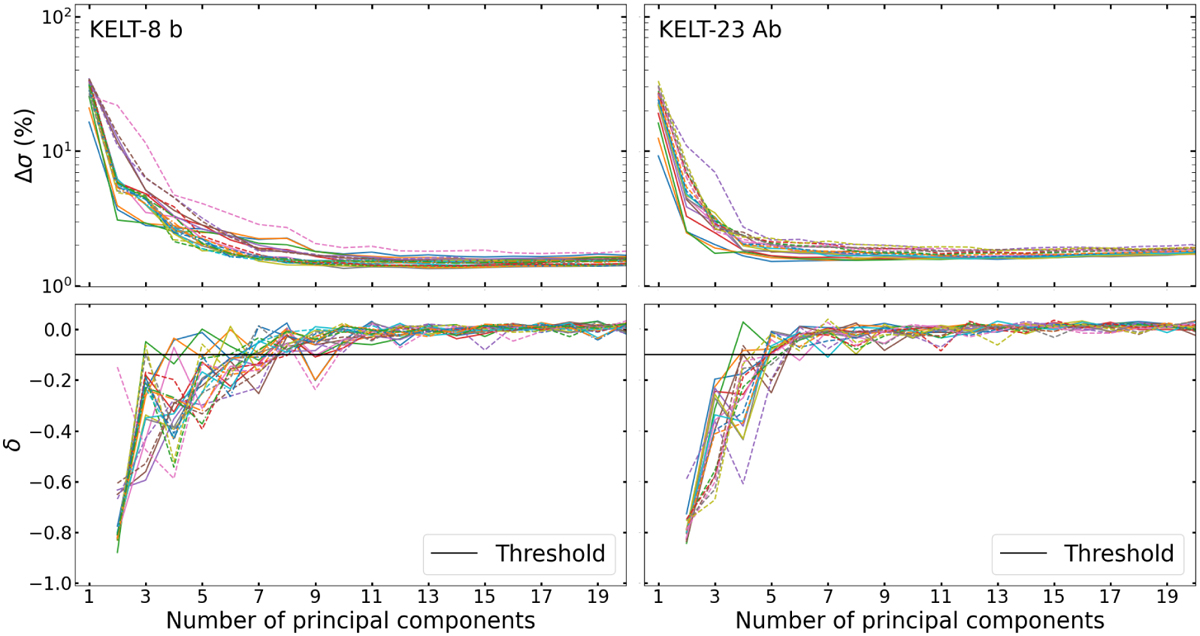
Variation of the standard deviation (σ) of the residuals as a function of the number of principal components removed via PCA for the KELT-8 b (left panels) and the KELT-23 Ab (right panels) dataset. Top panels: relative variation ∆σ of the standard deviation of the residuals (expressed in percentage value and reported in logarithmic scale for better visualisation) in the different spectral orders (coloured solid and dashed lines). Bottom panels: relative variation of ∆σ (δ) in the different spectral orders (coloured solid and dashed lines). The solid black horizontal line represents the −0.1 threshold on δ used to identify the minimum number of principal components to select in order to remove the telluric and stellar contamination.
Current usage metrics show cumulative count of Article Views (full-text article views including HTML views, PDF and ePub downloads, according to the available data) and Abstracts Views on Vision4Press platform.
Data correspond to usage on the plateform after 2015. The current usage metrics is available 48-96 hours after online publication and is updated daily on week days.
Initial download of the metrics may take a while.