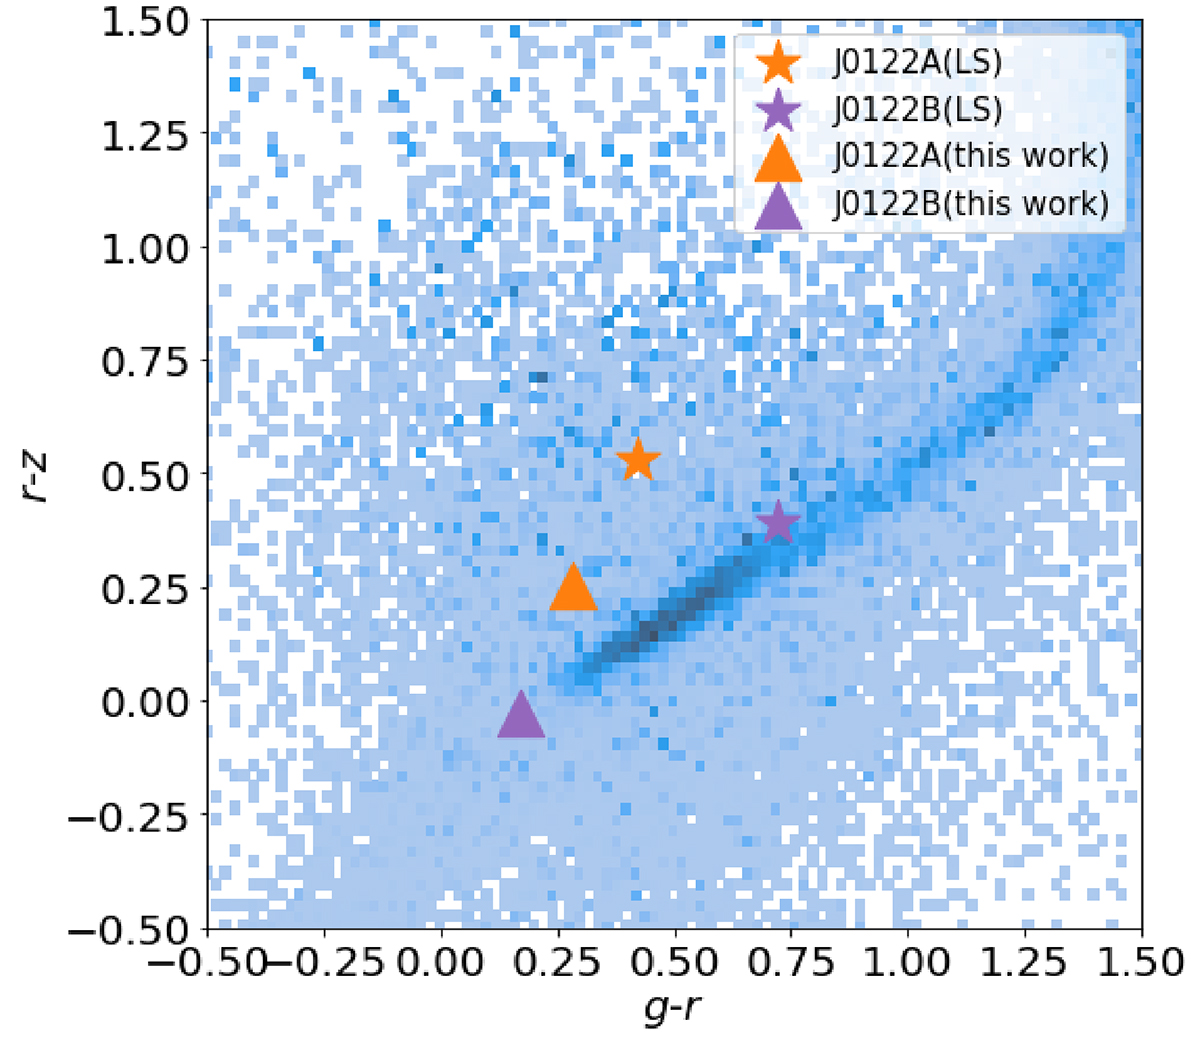
Fig. 7.
Download original image
Colour-colour plot for J0122−1344 is displayed, with blue points indicating stars. The yellow and purple pentagrams represent J0122−1344A based on Legacy Survey Imaging photometry. Furthermore, the yellow and purple triangles correspond to J0122−1344A and J0122−1344B, respectively, as determined by the light modelling results from this study, which utilises two PSFs, along with one Sérsic profile (refer to Appendix A).
Current usage metrics show cumulative count of Article Views (full-text article views including HTML views, PDF and ePub downloads, according to the available data) and Abstracts Views on Vision4Press platform.
Data correspond to usage on the plateform after 2015. The current usage metrics is available 48-96 hours after online publication and is updated daily on week days.
Initial download of the metrics may take a while.