Open Access
Fig. 4.
Download original image
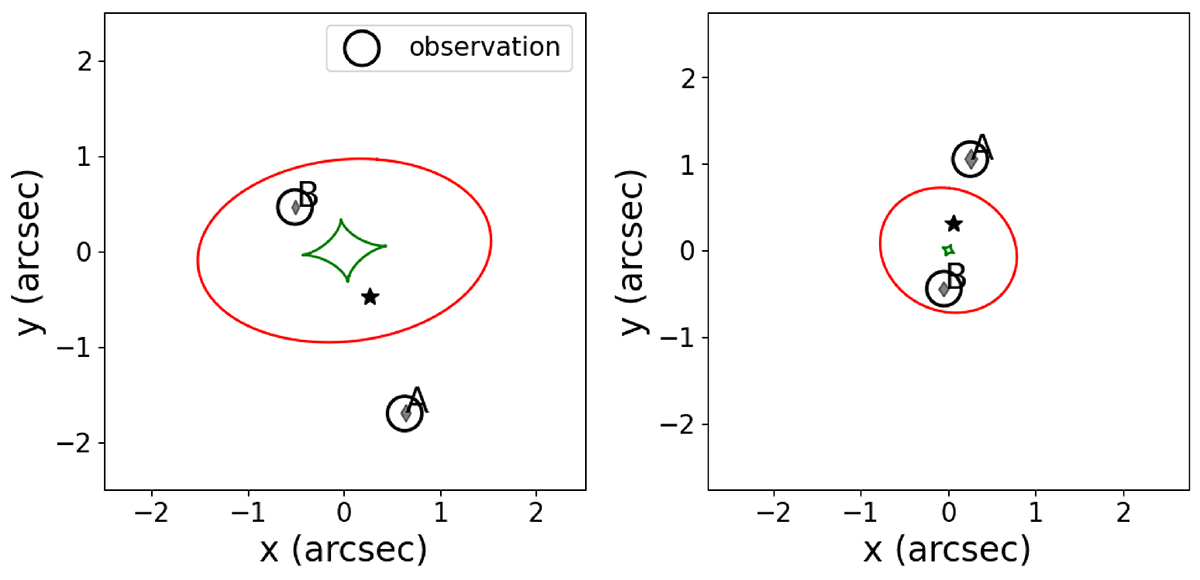
Modelled caustic and critical curves, along with the positions of images for the two confirmed lenses shown in Figure 2, are compared with the observed positions of multiple images. The plots are centred around the lens light centre, which is determined through light modelling and provided in Table 4.
Current usage metrics show cumulative count of Article Views (full-text article views including HTML views, PDF and ePub downloads, according to the available data) and Abstracts Views on Vision4Press platform.
Data correspond to usage on the plateform after 2015. The current usage metrics is available 48-96 hours after online publication and is updated daily on week days.
Initial download of the metrics may take a while.