Fig. 6
Download original image
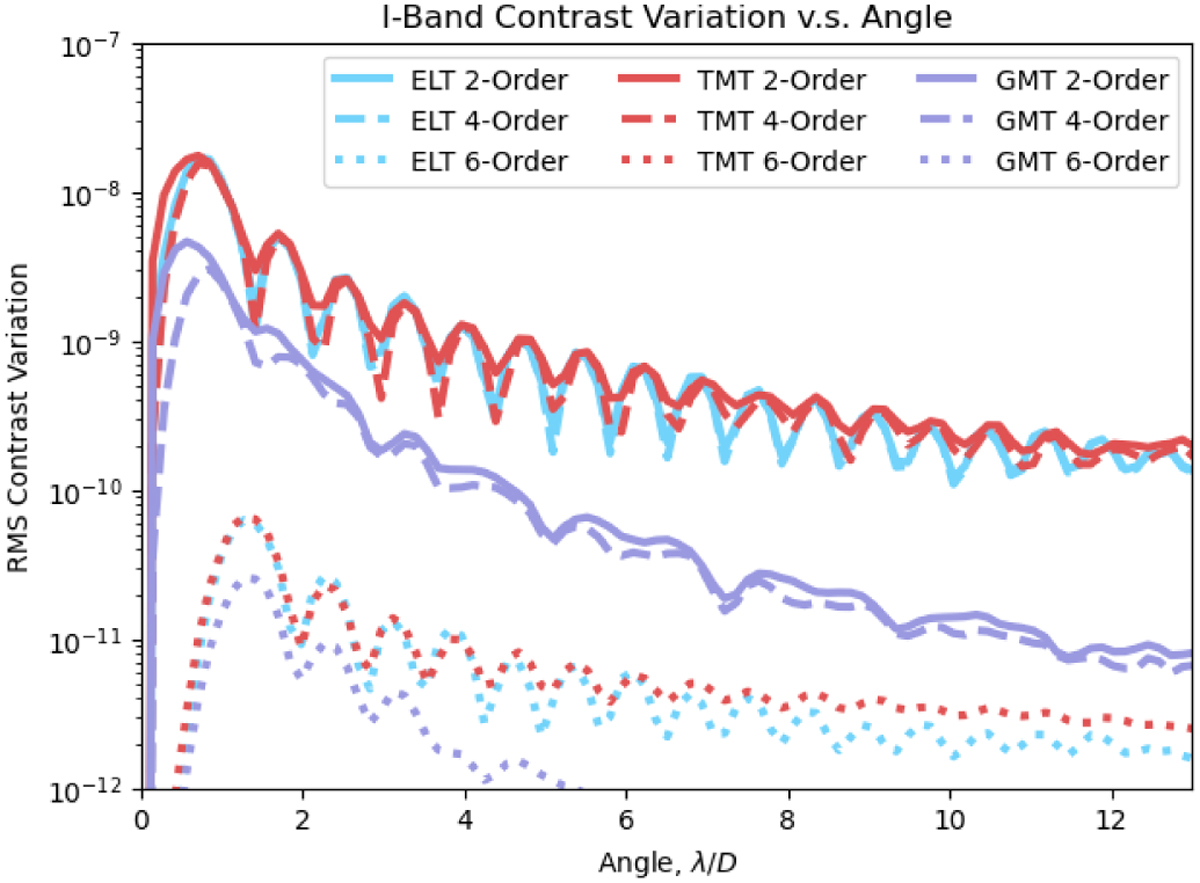
RMS contrast variation as a function of angular separation for Case 2 in I-band. The lines represent the azimuthal average of the standard deviation of the simulated coronagraphic residuals. One can interpret these data as the anticipated contrast degradation due to coating variations. We observe that order 2–4 coronagraphs do not have substantially different performance, with an RMS contrast variation near the inner working angle of ≈10–8 for the TMT and ELT, and ≈5 × 10⁻⁹ for the GMT. Order 6 coronagraphs have a much tighter standard deviation, which is below 10−10 contrast. These data suggest that segment-to-segment errors will not be a dominant effect that limits high-contrast imaging. For the curves that represent Case 1 and 3, please refer to the appendices.
Current usage metrics show cumulative count of Article Views (full-text article views including HTML views, PDF and ePub downloads, according to the available data) and Abstracts Views on Vision4Press platform.
Data correspond to usage on the plateform after 2015. The current usage metrics is available 48-96 hours after online publication and is updated daily on week days.
Initial download of the metrics may take a while.