Open Access
Fig. B.1
Download original image
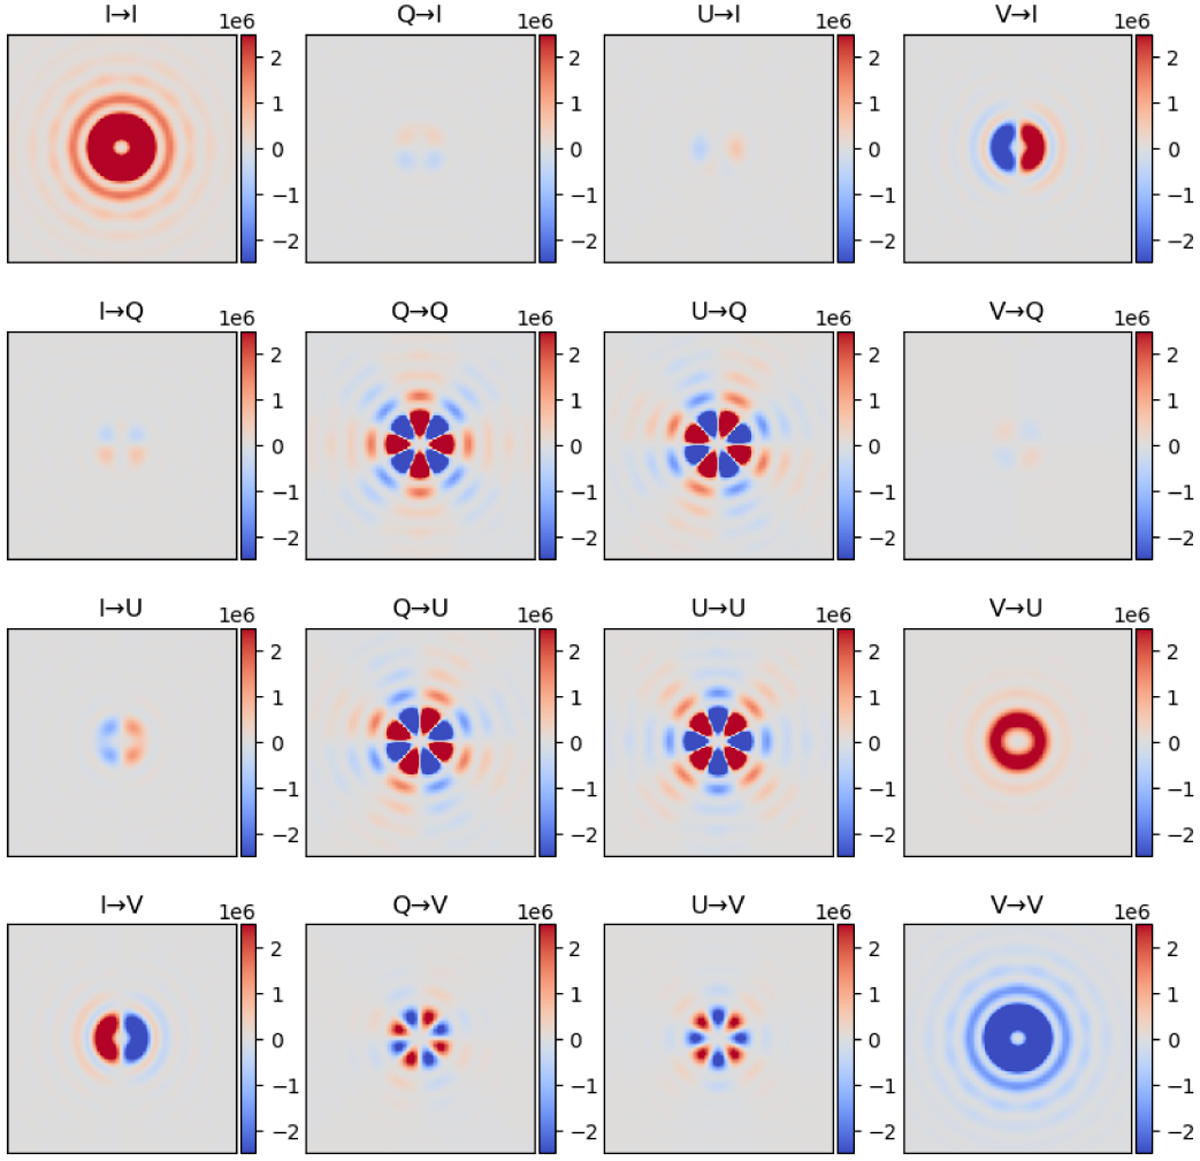
Figure showing the Mueller PRM Mcoro for the ELT in I-band to show how polarization shapes the PSF. These data are normalized to the peak of the I → I component. The data here is plotted with a colorbar such that bright signals are saturated to enhance the structure in the first lobe of the PRM elements.
Current usage metrics show cumulative count of Article Views (full-text article views including HTML views, PDF and ePub downloads, according to the available data) and Abstracts Views on Vision4Press platform.
Data correspond to usage on the plateform after 2015. The current usage metrics is available 48-96 hours after online publication and is updated daily on week days.
Initial download of the metrics may take a while.