Open Access
Fig. A.1
Download original image
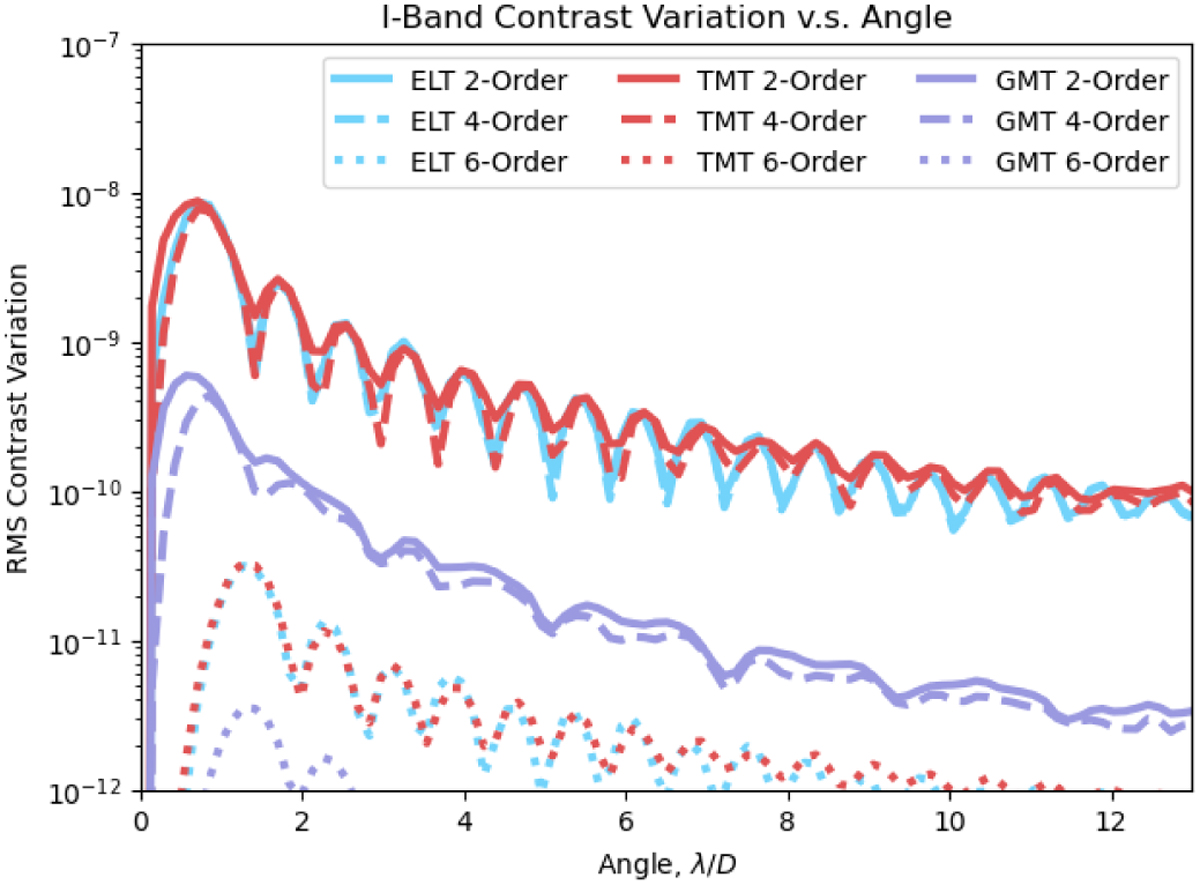
RMS contrast variation as a function of angle for Case 1 in I-band. The lines represent the azimuthal average of the standard deviation of the simulated coronagraphic residuals. These trends tend to mimic the behavior in Figure 6, but be a factor of 2-5 lower in RMS contrast.
Current usage metrics show cumulative count of Article Views (full-text article views including HTML views, PDF and ePub downloads, according to the available data) and Abstracts Views on Vision4Press platform.
Data correspond to usage on the plateform after 2015. The current usage metrics is available 48-96 hours after online publication and is updated daily on week days.
Initial download of the metrics may take a while.